
With the tendency to collect and use data is increasing exponentially, it becomes more important to visualize that data. Developers are trying to bring together the records in different databases into dashboards and beautiful charts which can be interpreted quickly and intuitively by humans.
Over the past decade, data visualization technology has improved continuously, and now consumers have advanced chart libraries made available to them.
The server-side image bitmap charts were used prominently during the early 2000s for chart and graph generation. Plugins like Silverlight and Flash offered more of interactive charting experience, but then it came at the expense of battery life, download speed, and system resources.
The boost in the mobile and tablet usage leads to a situation where plugins were no more supported by the mobile platforms and this way moving to open client-side technologies which could run everywhere became the choice of developers. At the same time, resolution -independent vector charts came to the limelight due to the advent of common zooming using touch gestures and very high-resolution screens.
So comes the time of data visualization where the use of SVG-Scalable Vector Graphics and JavaScript is in use. Today charts and graphs are available which support all the browsers, support interactivity and animations and come without special plugins. These charts look well across high-resolution devices. This has been made possible with Javascript Development using several JavaScript chart libraries.
There are several such JavaScript charting libraries available in the market but, here we are with a list of few ones which stands out from others and can be used for your project in 2023.
Here is a List of Top Javascript Charting Libraries which you can use in 2023.
D3.js – The Most Popular JavaScript Chart Library
Compared to other JavaScript graph libraries, D3 does exceptionally well, which includes some of the smaller technical modules like colors, axes, contours, hierarchies, polygons, easing, and more. Now all this together points to the fact that you have much to learn here and it is not easy.
It can be complicated to even trying to create a simple chart. You need to explicitly define all the elements which include chart items and axes. How CSS can be made used to style chart elements can be seen in different samples. Charting-based features cannot apply automatically.
If you want to get deep and make use of creativity to have complete control over the elements, then it would be the best decision. It may not be the best thing to do from the beginning to complete the data visualization project requirements by working against the clock.
For a charting library, D3.js can act as a building block. To come up with animated graphical solutions which can easily consume D3 like NVD3, developers are making use of it. This JS charting library is free and open source in nature.
Stars on Github
forks on GitHub
npm weekly downloads
Latest Stable Version
Highcharts – Most Commonly Used JavaScript Graph Library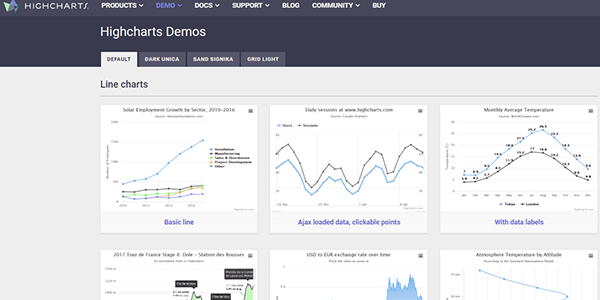
Highcharts is one of the best JavaScript Charting libraries available in the market and, is used by a number of big companies. For backward compatibility through IE6 to IE8, charts are generated by making use of SVG and then turn to VML. The demo charts come with some amazing features, but visually they fail to impress. Here the tutorials for API documentation and many relevant topics are included in the general documentation.
Here the API is easy to use, and the chart makes use of configuration options to develop interactive graphical chart visualization. For personal and non-commercial use, Highcharts is free to use. For stock and other usage, commercial licensing is needed while separate licenses are required for Gantt, and map charts.
Stars on Github
forks on GitHub
npm weekly downloads
Latest Stable Version
Chart.js – A Flexible JS Charting Library
The sample visuals include initial animations when you are using it for the first time for drawing and are more of a modern looking. When adding data points or series in real-time, it animates smoothly. You can modify the chart options and redraw the chart by calling an update() function.
In the website gallery sample source code is not shown, but you can see it in the GitHub repo. Here the API is intuitive and clean. To create and modify a chart, configuration options are used.
The documentation comes in detail and comes with tutorials for code snippets and property API.
This library is free to use for commercial and personal use. It is open source in nature. For advanced requirements, having a limited number of types can cause some issues.
Stars on Github
forks on GitHub
npm weekly downloads
Latest Stable Version
amCharts – JavaScript Chart Library for Data Visualization
Demo charts are beautiful, and most of them offer a slider UI, and a number of palettes adjust the variables of the chart in real-time. The documentation includes full API property descriptions and many tutorials. Creating charts follow more of a declarative API and a little bit different from the configuration-based approach. It offers you a better experience in terms of code completion but requires slightly more codes when it comes to configuring charts. For branded charts, amCharts offers a free license and for others offers paid licenses.
Stars on Github
forks on GitHub
npm weekly downloads
Latest Stable Version
Google Charts – Best JavaScript Chart Library by Tech-giant
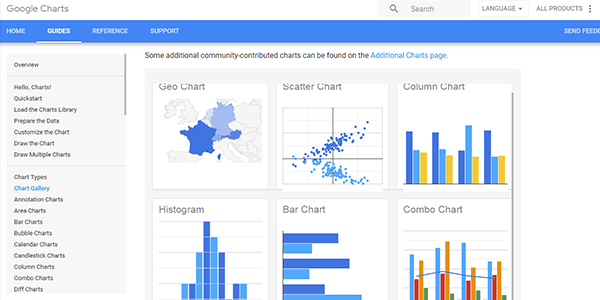
Here each chart type has been explained well using live examples that come with dedicated tutorials. The tutorials come with API listings and have code for related features. When it comes to working with a new JavaScript graph library, it offers a pleasant experience.
By using configuration options object, charts can be customized. DataTable class is used to populate data sets, and it can be used by all charts too. Each chart type comes with options listed in a unique manner, and they come in type-specific tutorials. Many options work on different types, and property naming is standardized.
Google charts are free to use, but it comes with some limitations. It cannot be hosted locally as it is a web service. If you are using it for critical projects, then you should think about using any other JS chart library as Google has retired APIs.
Stars on Github
forks on GitHub
npm weekly downloads
Latest Stable Version
ZingChart –
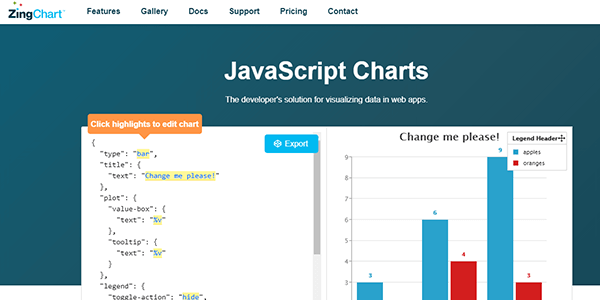
You will find a number of styling themes in the demo charts and some of them look quite good too. In order to style them, you can find a number of options there as well. The demos do not demonstrate all the chart types available here.
The documentation comes with tutorials for a number of features, for all types of JavaScript Charts and a complete API listing. To customize charts, ZingChart makes use of configuration options. Different property settings, like font styling, are included in the samples. To know what settings you need for a given chart, these samples with property settings can get in the way of understanding.
With branding, ZingChart can be used for free. For non-branded usage, paid licensing is available.
Stars on Github
forks on GitHub
npm weekly downloads
Latest Stable Version
FushionCharts
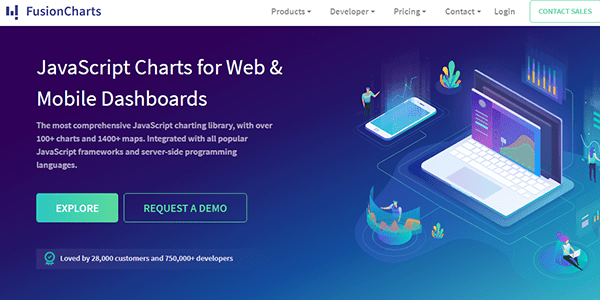
The chart gallery comes with a number of examples and has a visual appearance that is clean. Documentation comes with a number of good API descriptions, and each chart type has examples. By task and chart features, the configuration properties are grouped.
Configuration based options are used in creating charts, and they are quite easy to be used. When digging deeper into the API, the list of properties can get lengthy. Configuration properties like showAlternateHGridColor, chartLeftMarginare shallow. This can be a step taken for code completion improvement.
For chart branding, FusionCharts is free to use at a personal level. For commercial and unbranded use, paid licensing is available.
Stars on Github
forks on GitHub
npm weekly downloads
Latest Stable Version
Flot
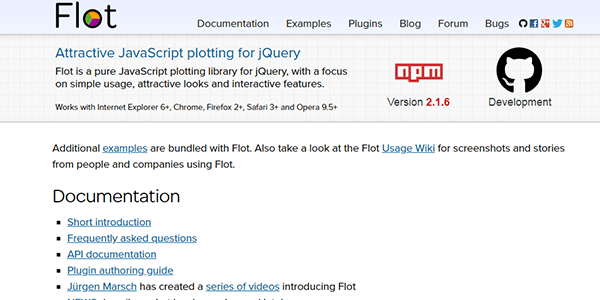
Flot basically used for creating a placeholder div where graph can be put in.
Stars on Github
forks on GitHub
npm weekly downloads
Latest Stable Version
Sigmajs
It comes with some exciting feature on board such as Canvas and WebGL renderers or mouse and touch support so that you can make dynamic network applications. Let’s check them out.
Sigmajs is configured by default and can be utilized using mouse and touch and can scale when the container size changes. Similarly, there are Custom Rendering, which enables developers with a set of tools and setting which can be customized how to get interacted with the network.
Stars on Github
forks on GitHub
npm weekly downloads
Latest Stable Version
Also Check our Article : Top Javascript Frameworks in 2023
Conclusion
The JavaScript chart library ecosystem is growing and evolving considerably. In order to meet the diverse needs of the projects, you will find a large number of charting products. To let you evaluate the effectiveness of the chart, most of them offer you a free trial.
Looking for Professional
JavaScript Development


 Say
Say