
Quick Summary:
Looking for the best React Chart Libraries to enhance your data visualizations? Choosing the right charting library can elevate your React project by making data more understandable and visually appealing. Key options include those with strong performance, customization, and ease of use. Here’s a list of most popular React charting libraries.
In this blog, we’re going to discuss 📝
To make data more accessible and impactful in your React projects, effective visualization is key. While manually crafting charts is feasible for smaller tasks, large-scale projects benefit significantly from leveraging top third-party React chart libraries.
These libraries not only streamline the development process but also offer advanced visualization options that enhance the clarity and appeal of your data presentations. In this guide, we’ll assist you in choosing the best React chart library to meet your project’s unique needs.
Best React Chart Libraries
We have compiled a list of popular React Chart Libraries for data visualization. Utilizing these libraries saves development time but implementing them can be challenging. An experienced ReactJS professional from a reputable ReactJS development company can assist in building a scalable, feature-rich frontend, allowing you to focus on analysing data rather than designing charts and graphs. 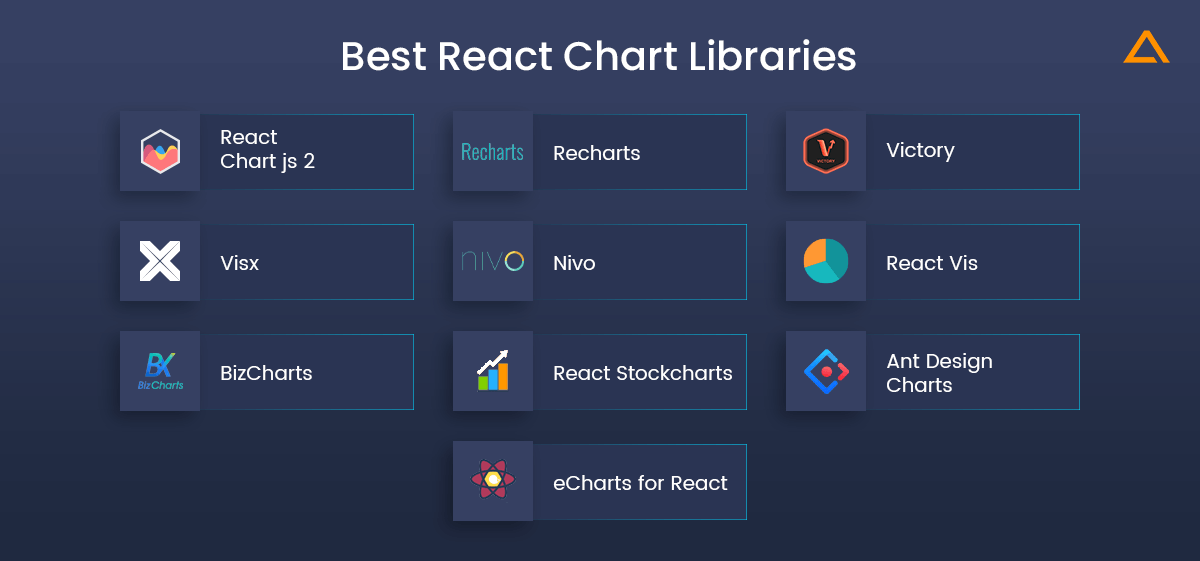
React Chart Libraries List
1. React Chart js 2
React components for Chart.js, the most popular React charting library.
Best for: Simple datasets requiring minimal customization
React Chart js 2 is a React wrapper for Chart.js, making it easy for developers familiar with Chart.js to create responsive React chart components using HTML5 Canvas. It’s ideal for simple datasets with minimal customization needs.
Key Features of React Chart JS 2
- 6 Different Chart Styles out-of-the-box
- Support for Animations
- Responsive Charts
- Customization Options
2. Recharts
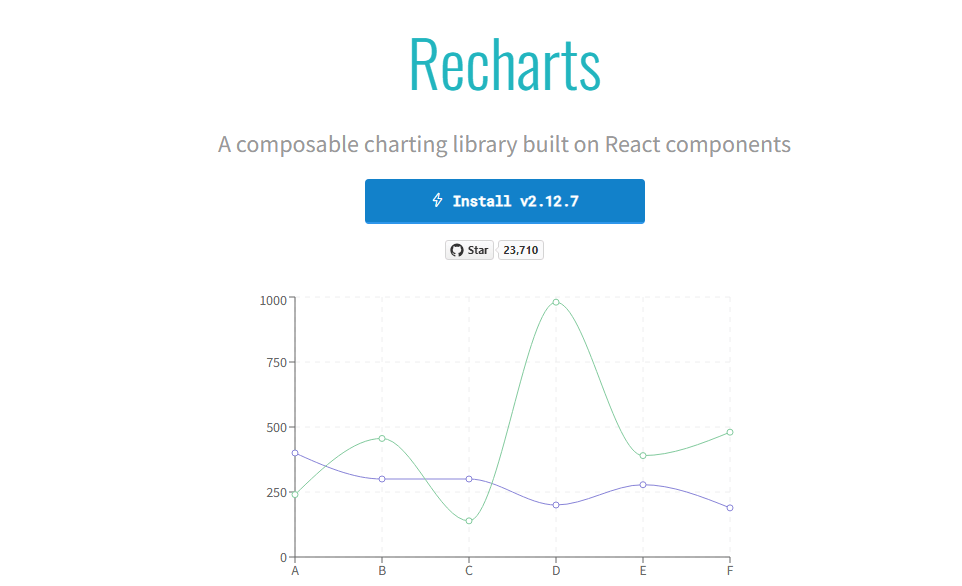
A composable React charting library built on React components.
Best for: Developers who need reusable components and SVG support
Recharts is one of the React best chart libraries based on React’s reusable component principle. It provides drawing supports for SVGs. It is one of the most popular data visualization methods for the React ecosystem.
Key Features of Recharts
- Beautiful charts out-of-the-box
- Tweaking of existing components or adding custom components
- Native SVG support
- Declarative components
3. Victory

React.js components for modular charting and data visualization.
Best for: Cross-platform applications and projects needing modular charting components
Victory is a great React data visualization library for experienced developers using React.js and React Native. It provides charting components with a single, consistent API that works for both web and mobile apps. This means you can create charts for both iOS and Android using the same API. It’s also easy to use and supports cross-platform charting.
Key Features of Victory
- Integration of various chart formats such as line, pie, bar and candlestick on web and Native Applications
- Cross-Platform charting support
- Animations and transitions
- Customizable components
4. Visx

Visx is AirBnB’s collection of expressive, low-level visualization primitives for React.
Best for: Creating complex visualizations with a smaller bundle size
Visx, developed by Airbnb, is a popular React data visualization library. It combines the strengths of React DOM and D3.js, offering a powerful toolset. Instead of being just a bar chart library, Visx provides a collection of low-level visualization tools and reusable components for creating custom charts and visualizations.
Key Features of Visx
- Smaller Bundle Size
- Ability to create complex visualizations like Chord, Treemap, Dendrograms
- D3 that helps perform mathematical computations
5. Nivo
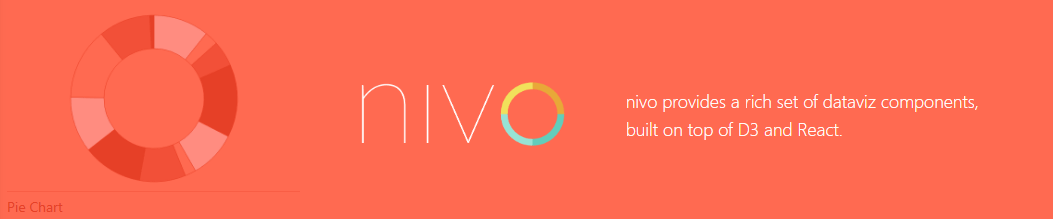
Nivo provides a rich set of DataViz components built on D3 and React.
Best for: Server-side rendering and responsive visualizations
Nivo is a powerful React chart library built on top of D3.js. Its React server-side rendering support sets it apart from most React data visualization libraries. With a wide range of templates, Nivo allows developers to create various data visualization charts and graphs. It’s an ideal choice for projects requiring responsive visualizations.
Key Features of Nivo
- Support for HTML, Canvas and SVG charts in single library
- Support for motion/transitions backed by React-motion
- Decent customization options
- In-built support for responsive charts
6. React Vis
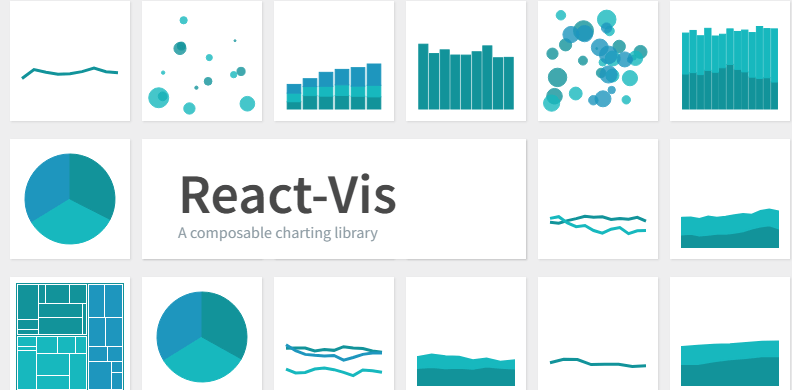
A compose React charting library from Uber.
Best for: Beginners and projects requiring a variety of chart types
React Vis, supported by Uber, is a beginner friendly React charting library. It offers a collection of React components to easily create common data visualization charts. With React Vis, you can visualize data using line, bar, area charts, scatterplots, hexagon heatmaps, pie charts, and more.
Key Features of React Vis
- Beginner Friendly Charting Solutions for React developers
- Flexibility for different types of charts
- Ease of use
- Seamless integration into React environment
7. BizCharts
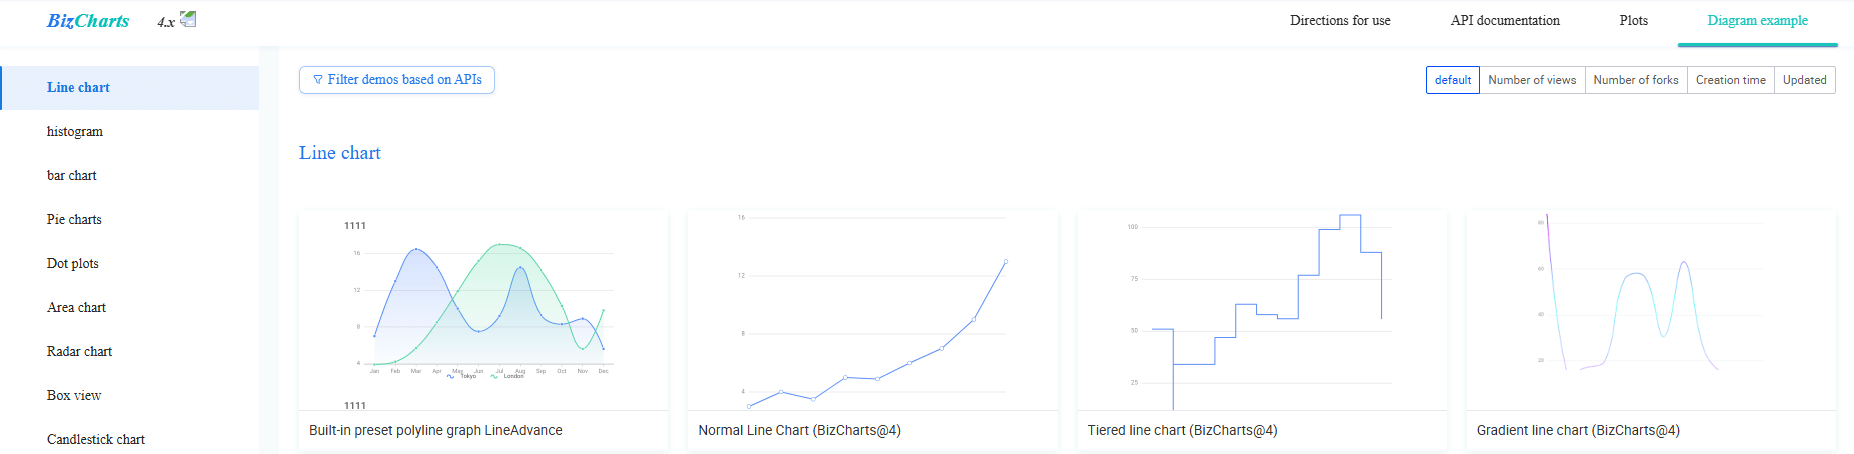
Visual solutions for the middle and back office of the enterprise.
Best for: Enterprise-level applications with a focus on ES6 syntax
BizCharts is a powerful library from Alibaba’s Ant Financial. It offers many chart types and is easy to use with minimal coding. ES6 syntax support and customizable templates make it ideal for interactive charts in React apps.
Key Features of BizCharts
- Easy to use charting library
- Strong expansion potential
- Support for most data visualization charts
- React ES6 grammar
8. React Stockcharts
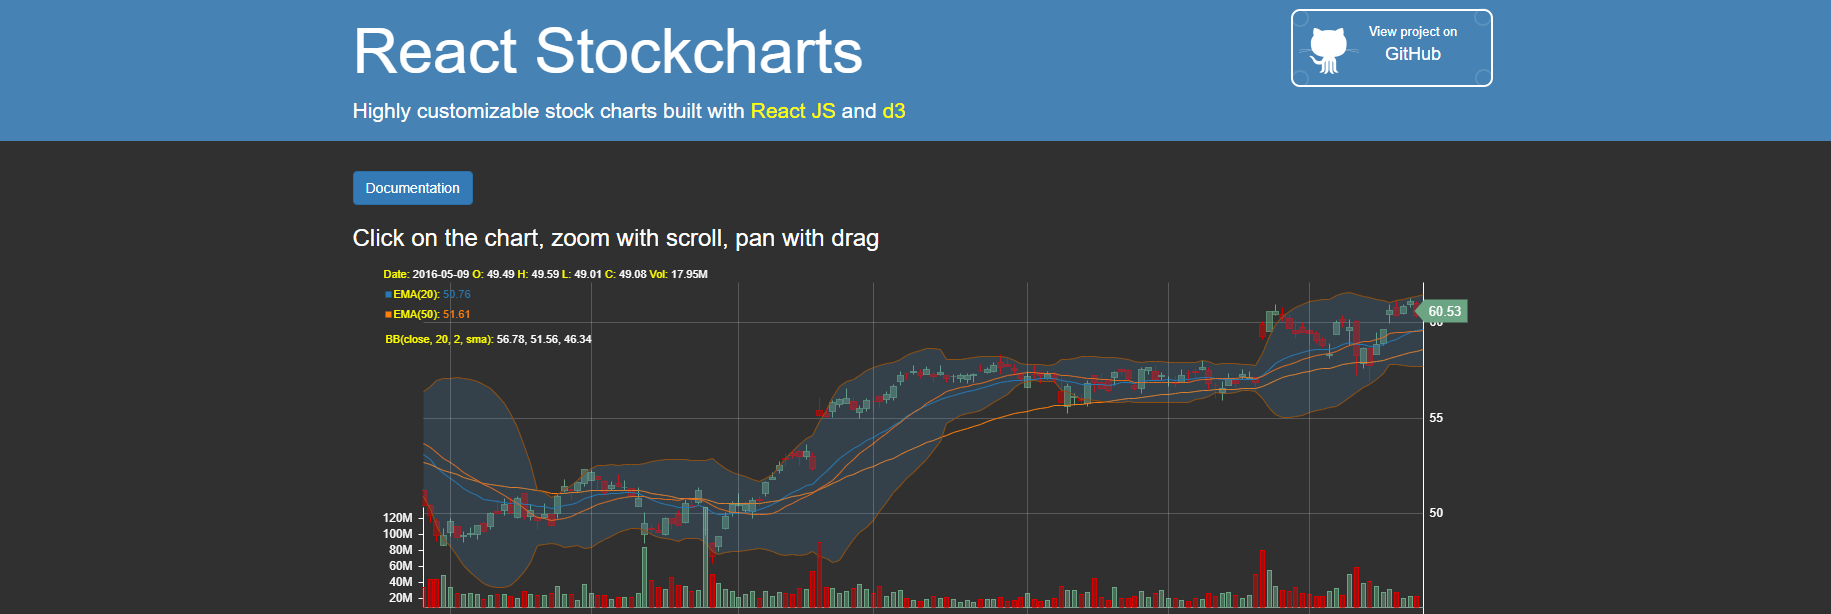
Highly customizable stock charts built with React JS and d3.
Best for: Financial data visualization and projects needing stock chart templates
React Stockcharts, as the name suggests, is the top React stock chart library with a variety of stock chart templates for your React app. In addition, it has more than 60 technical indicators and overlays which makes it the perfect choice for your financial data visualization needs. It is built with React.js and D3.
Key Features of React Stockcharts
- Integration with multiple chart types
- Over 60 technical indicators and overlays
- Drawing objects
9. Ant Design Pro
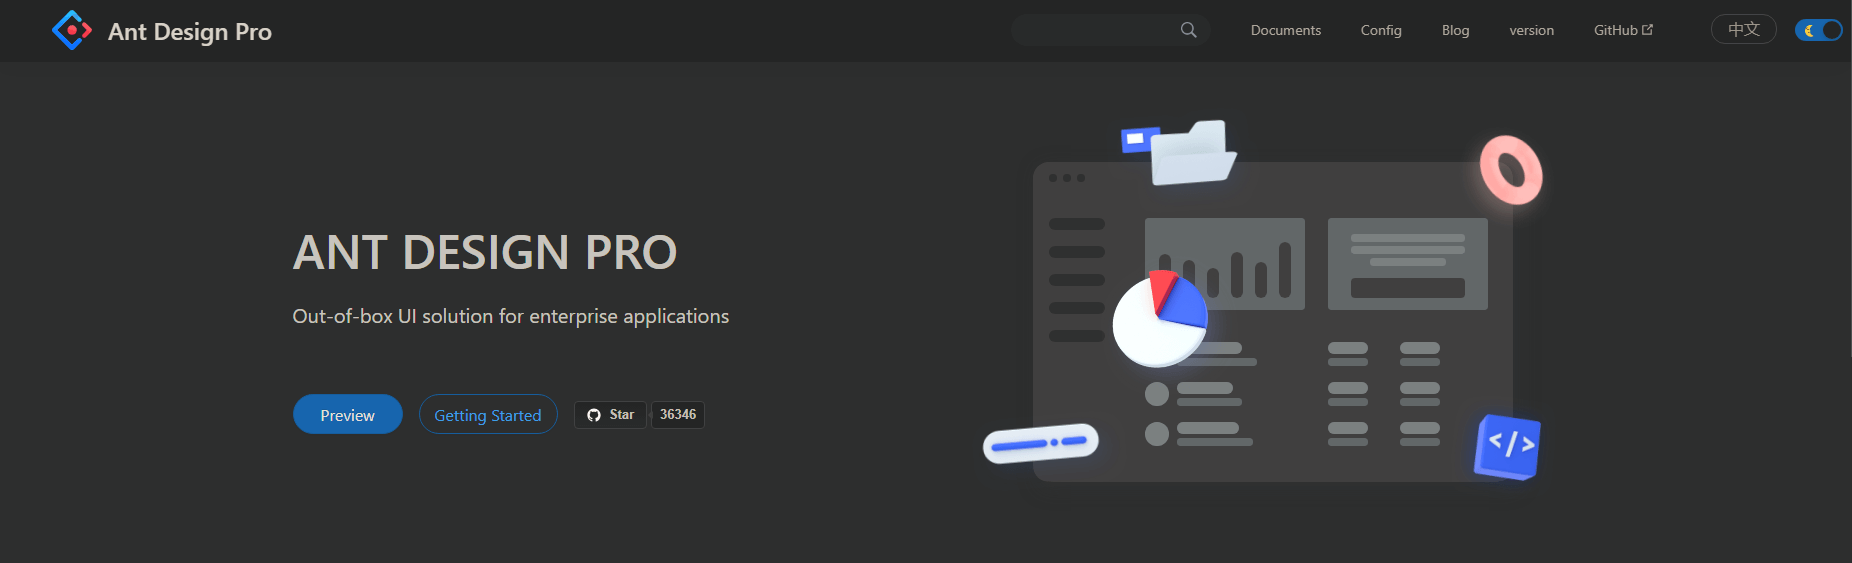
Out-of-box UI solution for enterprise applications.
Best for: Projects requiring easy-to-use, out-of-the-box solutions
Ant Design Pro is the React version of Ant charting library and is a popular React charting library among students and development teams alike. It provides out-of-the-box high-quality charts with a heavy focus on development experience and user experience in its default configurations.
Key Features of Ant Design
- Easy configuration
- Detailed and accurate data representation
- Optional customization options with ready-to-use default chart solutions
- Responsive charting solutions
10. eCharts for React
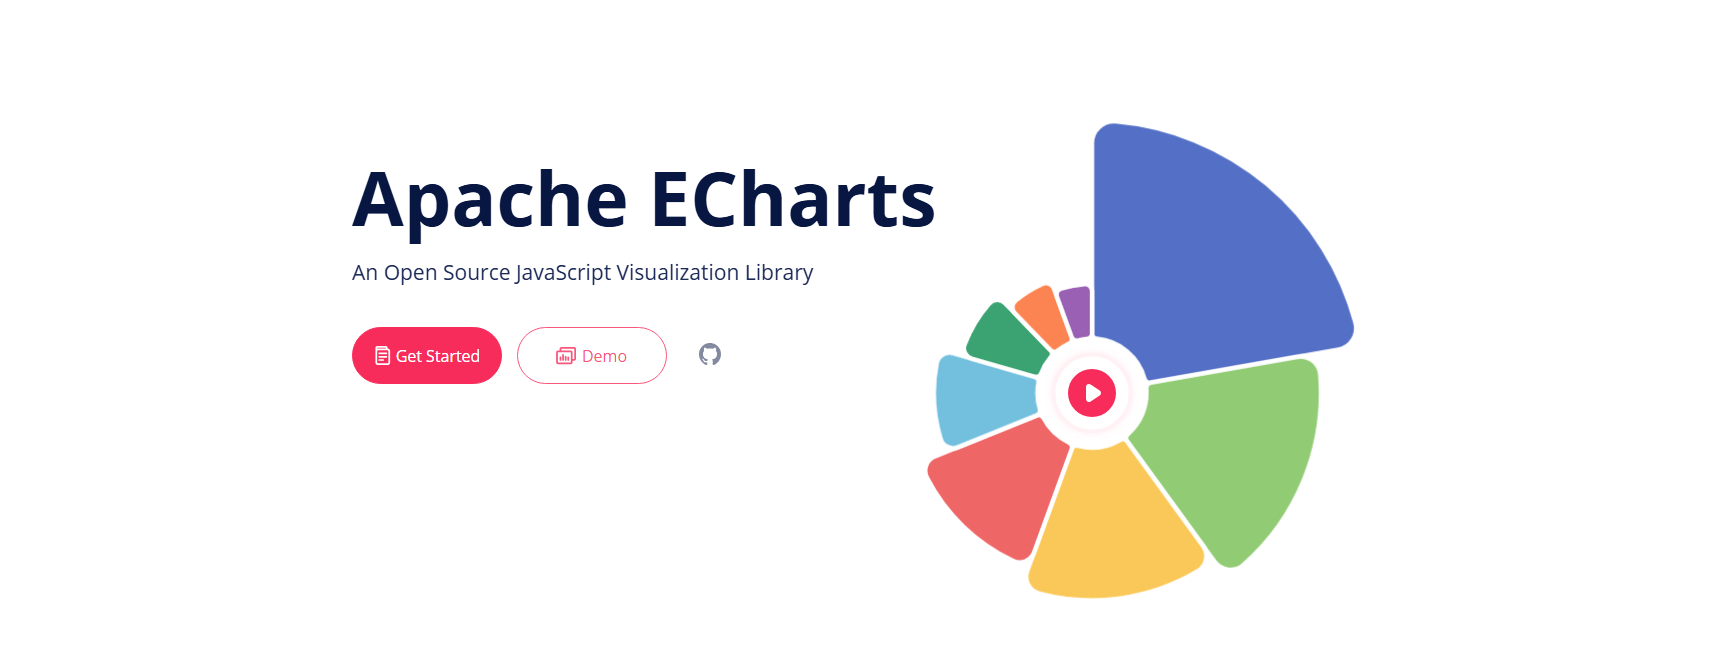
An Open-Source JavaScript Visualization Library.
Best for: Projects needing highly customizable and interactive charts
Apache eCharts is a free and powerful visualization and charting library that allows developers to easily integrate intuitive, interactive and highly customizable charts in their commercial products. eCharts for React is written in pure JavaScript and is based on zrender.
Key Features of eChart for React
- Multi-rendering support
- Cross platform support
- Dynamic data and special effects
- Mobile optimization
- Accessibility features
11. React-google-charts

A thin, typed, React wrapper for Google Charts.
Best for: Simple and intuitive integration of Google Charts
React-google-charts is a valuable tool for adding Google Charts to React.js apps. Its simplicity and ease of use make it accessible to developers of all levels. It allows you to create visually appealing, interactive charts using Google Charts within React projects.
Key Features of React Google Charts
- Simple and intuitive API for React Developers
- Support for wide range of chart types, including line, pie & others
- Customization options to tailor appearance and behaviour of charts
- Integration with React components for seamless implementations
- Comprehensive documentation and examples
12. D3.js
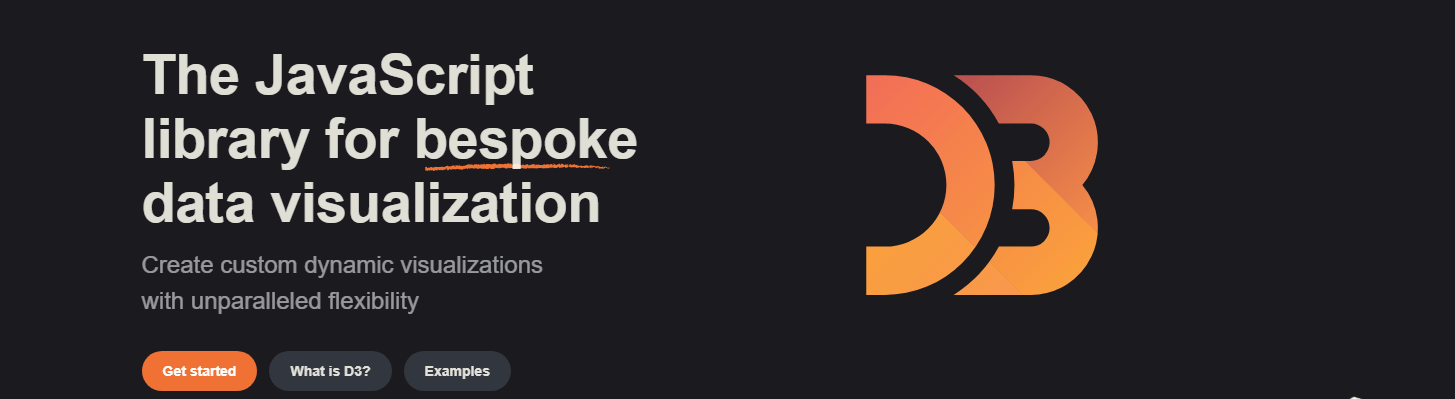
The JavaScript library for bespoke data visualization.
Best for: Projects requiring bespoke data visualizations
D3.js stands out as a powerful charting library for React for creating dynamic and interactive data visualizations in web browsers. It provides unparalleled flexibility and control on the visualization process. The developers have the freedom to manipulate every aspect of the visualization, from data binding to rendering.
Key Features of D3.JS
- Low-level manipulation of DOM elements
- Support for wide range of data formats – JSON, CSV and GeoJSON
- Modular structure for building complex visualizations from reusable components
- Active community and extensive resources for learning & support
13. React Financial Charts
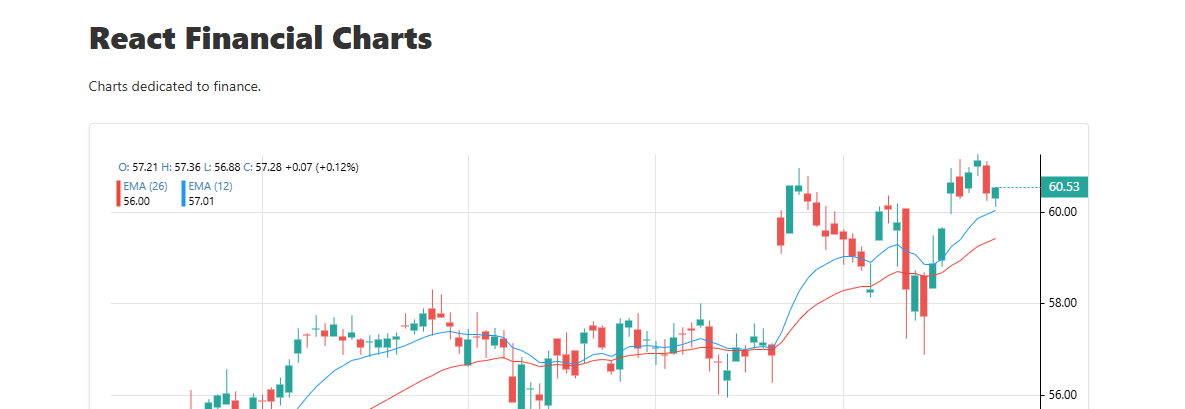
Charts dedicated to finance.
Best for: Financial analysts and traders needing specialized chart types
React Financial Charts is a tailored React financial data visualization library that offers dedicated chart types and features optimized for financial data. It can cater to the specific needs of the financial analysts and traders, providing tools for visualizing stock prices, market trends and other such financial metrics.
Key Features of React Financial Charts
- Candlestick charts for visualizing open, high, low and close prices over time
- Line charts with annotations for highlighting key events or indicators
- Support for technical analysis indicators like moving averages
14. MUI X Charts
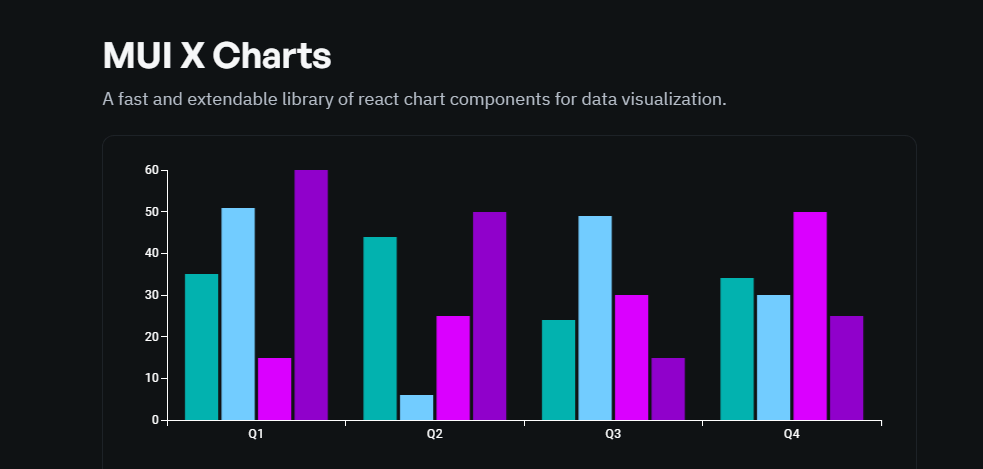
A fast and extendable library of react chart components for data visualization.
Best for: Projects using Material Design principles
MUI X Charts is the ideal charting library option of Material-UI ecosystem. It offers React components for creating charts that matches Material Design aesthetics. Its unique offerings lie in its integration with Material Design principles, providing developers with a cohesive set of components that align with visual language of Material Design.
Key Features of MUI X Charts
- React components designed as per Material Design Guidelines
- Support for various chart types including bar, line, area and scatter plots
- Theming capabilities for customizing appearance of charts
15. React Chartkick
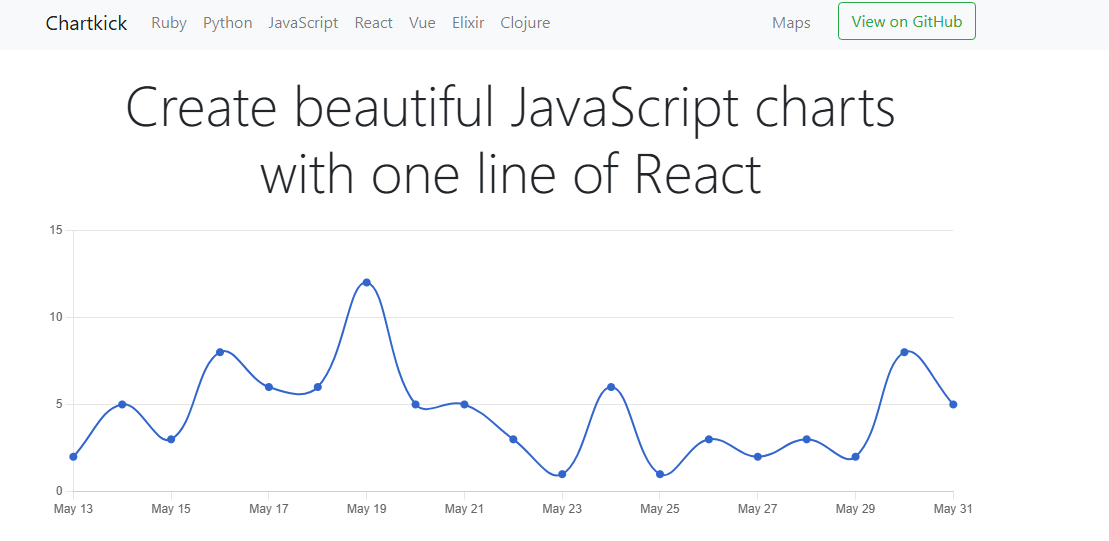
Create beautiful JavaScript charts with one line of React.
Best for: Developers needing quick and simple chart creation
React Chartkick is a React wrapper for Chartkick, which offers a straightforward approach to creating charts using Chart.js or Google Charts. Its simplicity and ease of use, allows developers to create charts with minimal configuration and code.
Key Features of Chartkick
- Simple API for generating charts with Chart.js or Google Charts
- Automatic data updates for real-time charting applications
- Support for responsive design
- Integration with server-side frameworks
- Compatibility with modern JavaScript frameworks and libraries
How to pick the right Charting Library for React? Real-Life Use Case & Scenarios
Scenario 1: Real-time Data Dashboard
Problem: A finance company needs a real-time dashboard to monitor stock prices and market trends.
Solution: React Stockcharts is ideal. It provides over 60 technical indicators and works well with React.js and D3.js, allowing you to create a dynamic, real-time dashboard for detailed financial analysis.
Scenario 2: Enterprise-Level Data Reporting
Problem: A large enterprise requires detailed and interactive reports for various departments.
Solution: BizCharts is a strong choice. Its wide range of chart types and modern ES6 syntax will help you create interactive reports easily, enhancing data presentation and supporting decision-making across the enterprise.
Scenario 3: Mobile and Web Cross-Platform Application
Problem: A startup needs a charting solution that works seamlessly on both mobile and web platforms.
Solution: Victory is perfect for this. It provides a consistent API for both web and mobile, ensuring your charts look and work the same on iOS, Android, and web, delivering a seamless user experience.
Scenario 4: Custom Data Visualizations
Problem: A data science project requires custom visualizations that are not supported by standard charting libraries.
Solution: D3.js is the ideal React charting library option for this. It offers the flexibility to create highly customized visualizations tailored to your specific needs, helping you tackle complex data visualization tasks effectively.
Scenario 5: Quick and Easy Chart Integration
Problem: A small business needs to integrate charts quickly into its existing React application without extensive coding.
Solution: React Chartkicks is one of the most popular React chart libraries for such situations. It offers a simple API for integrating Chart.js or Google Charts, making it easy to add charts quickly and efficiently with minimal development effort.
Best React Chart Libraries Selection Metrics
There are a few things we often look out when finding the right ReactJS charting library for our client. Here is a quick cheat-sheet to find the ideal data visualization library for your React projects.
1. Chart Types and Customization
- What variety of chart types does the library offer (e.g., line charts, bar charts, pie charts)?
- Does the library provide extensive customization options for each chart type?
- Can you customize styling, labelling, and interactivity?
2. Performance and Scalability
- How does the library perform with large datasets or real-time data updates?
- Is the library optimized for rendering and memory efficiency?
3. Ease of Integration
- How easy is it to integrate the library into your existing React project?
- Are there clear and well-documented resources available?
- Does the library have well-defined APIs and compatibility with popular React frameworks and tools?
4. Features and Functionalities
- Does the library offer the specific features you need (e.g., animation support, data streaming, tooltips)?
- Are there additional functionalities that enhance its usability?
5. License and Cost
- What are the licensing terms for the library, especially for commercial projects?
- Are there any associated costs, such as subscription fees or licensing fees?
6. Cross-Browser Compatibility
- Is the library compatible with a wide range of web browsers?
- Does it require minimal or no effort to ensure compatibility across different browsers?
7. Ease of Customization
- Can you easily customize chart types, colors, and other visual elements?
- How flexible is the library in allowing changes to default settings and functionalities?
8. Learning Curve
- How much time will you need to learn and use the library effectively?
- Does the library require extensive setup and learning, or is it easy to pick up and use quickly?
9. Support for Various Input Formats
- Does the library support multiple input formats beyond JSON?
- Is it adaptable to different data types and changing requirements?
Wrapping Up!
These are the top React Chart Libraries you can use for your React apps and visualizing your data into appealing, useful, customizable and organized structures to better understand and present important data for coming up with relevant strategies and making better business decisions.