Quick Summary: The best APM tools make it simple and easy to manage the applications and boost performance. This is important because it’s one thing to manage IT infrastructure & network, but its application often needs the most attention. Application performance monitoring tools can reduce the management burden, providing a single platform to manage the burden by managing all the apps rather than managing and troubleshooting it individually.
In this digital age, Application Performance Monitoring is becoming crucial for monitoring the performance of software applications. APM ensures that the issues related to application performance are defined and identified. Application performance can be monitored or tracked using different categories like load time, response time, and apdex score.
Before diving into the application performance monitoring tools, let’s first understand what application performance monitoring is.
What is Application Performance Monitoring: Definition
Application performance monitoring encompasses controlling overall performance, including code, application dependencies, transaction timings, and user experience. Monitoring may appear to be a minor aspect, yet it is crucial. First, it raises awareness of the issue.
You can observe where users encountered problems and why they happened by using the warning issued to your monitoring tool. Such a method gives a complete insight into app performance, assisting DevOps teams in identifying problems and preparing to respond to similar problems in the future.
Components of a complete application performance management solution:
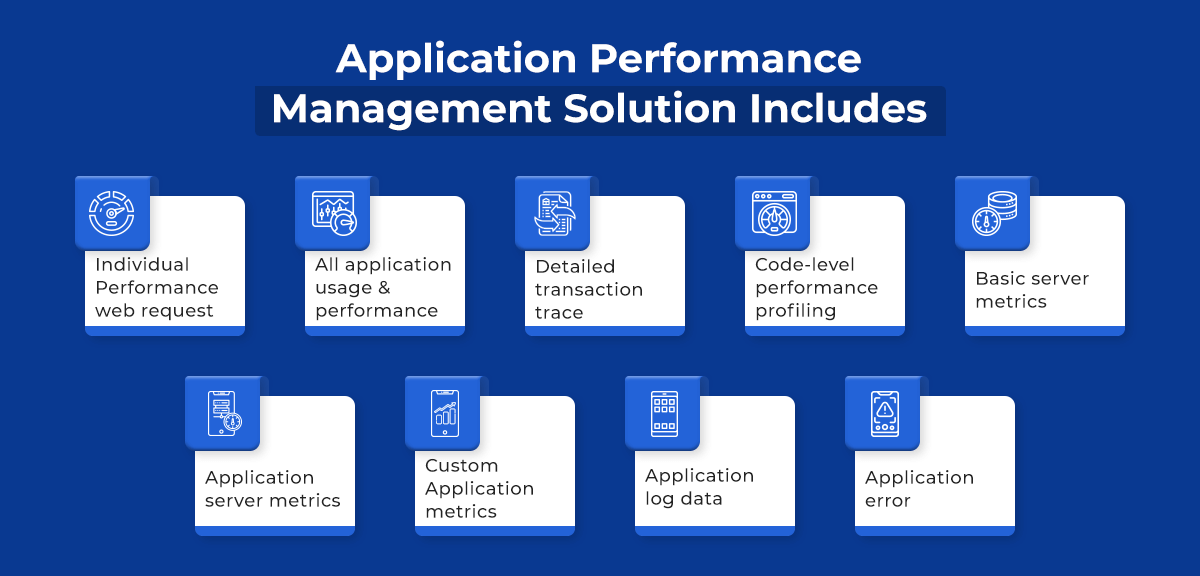
- Individual Performance web request
- All application usage & performance
- Detailed transaction trace
- Code-level performance profiling
- Basic server metrics
- Application server metrics
- Custom Application metrics
- Application log data
- Application error
Application Performance Monitoring Tools To Use While Writing Code.
APM Tools are typically associated with production servers, but developers can use other APM Tools while writing and testing their code. For example, with the help of lightweight code profilers or other technology, they may track transactions in great detail.
There are various tools for you to employ depending on which programming language you are using. These tools differ in terms of features and functionality. The following is a list of some of the tools that are used during coding.
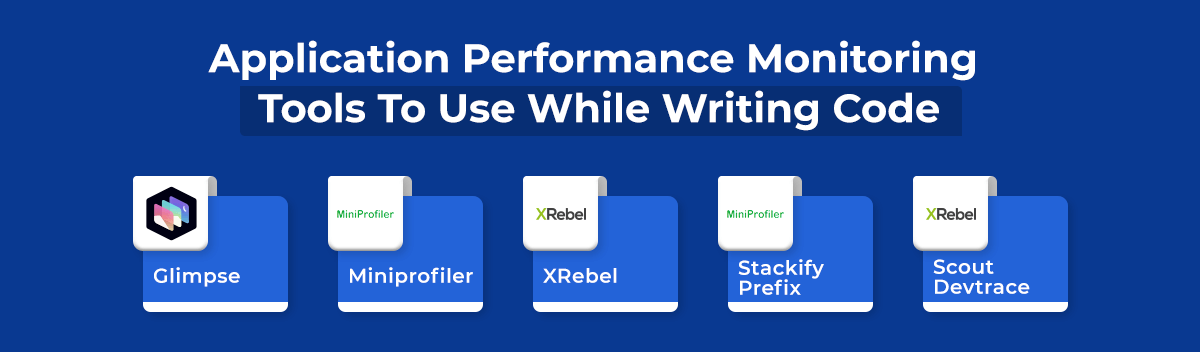
Glimpse (Free)
Github Stars: 2.3k
Glimpse provides you with a lot of information about a single web request as well as your server’s setup. It is an open-source diagnostics platform for the web.
Features of Glimpse
- Visual Profiling
- Transparent Data Access
- View Rendering & Resolutions
- Route Debugging
- Server Configuration
- Improved Tracing
Miniprofiler (Free)
Github Stars: 2.4K
If you add some code to your app for the steps you wish to track, Miniprofiler can track database queries and provide further details. It is a library & UI profiling your application. It helps you find the issue and optimize performance.
Features of Miniprofiler
- Database Profiling
- Call-stack Profiling
- Memory Profiling
XRebel (Freemium)
Cost: Free trial ten days, $365/year
Traditional profiling tools can’t do what XRebel can. It enables programmers to track the impact of their code from start to finish, even in distributed applications. XRebel is a must-have tool for any Java developer because of this, as well as real-time Java performance measurements. As a result, developers can utilize XRebel to design higher-performing applications that provide a better end-user experience.
Features of XRebel
- Improved Performance
- Increased Visibility
- Monitor SQL / NoSQL IO
- Trace Microservices
Stackify Prefix (Free)
Stackify Prefix is the dynamic code analysis tool. It is a lightweight web request profiler built to help developers. Prefix’s dynamic code analysis reduces dreaded code churn by validating the behaviour of code with detailed code-level traces, logs by request, hidden exceptions, and SQL query monitoring.
Key features of Stackify Prefix
- Low application overhead
- .NET performance Monitoring
- Lightweight code profiling
- Supports Cloud
- Supports logs
- Metrics & Performance counter
Scout Devtrace (Freemium)
Basic: $129/mo, Pro: $161/mo, Enterprise: Contact Vendor
Scout Application Monitoring is a lightweight, production-grade application monitoring service built for the modern development team. It supports Ruby, Python, PHP, Elixir, & Node.js apps.
Key Features of Scout Devtrace
- Transaction Trace
- SQL Queries
- Code Back Tracing
- Trace View
- Summary View
- Timeline View
- Trace Explorer
- Memory Bloat Detection
- Memory Bloat insight
- Memory Traces
Tips To Select Application Performance Monitoring Tools
Traditionally, application performance management solutions were only available to large businesses and were used to track business transactions. However, in recent years, APM tools have grown more inexpensive and essential for all enterprises. APM technologies have become an important aspect of DevOps initiatives.
Key things to consider:
- Programming Language
- Cloud Support
- Saas vs On-premises
- Pricing
- Ease of Use
Now that we’ve seen some pointers on how to choose an application performance monitoring profiler. Take a look at the list of application performance monitoring tools.
Application Performance Monitoring Tools List
The following is the list of the best application monitoring tools.
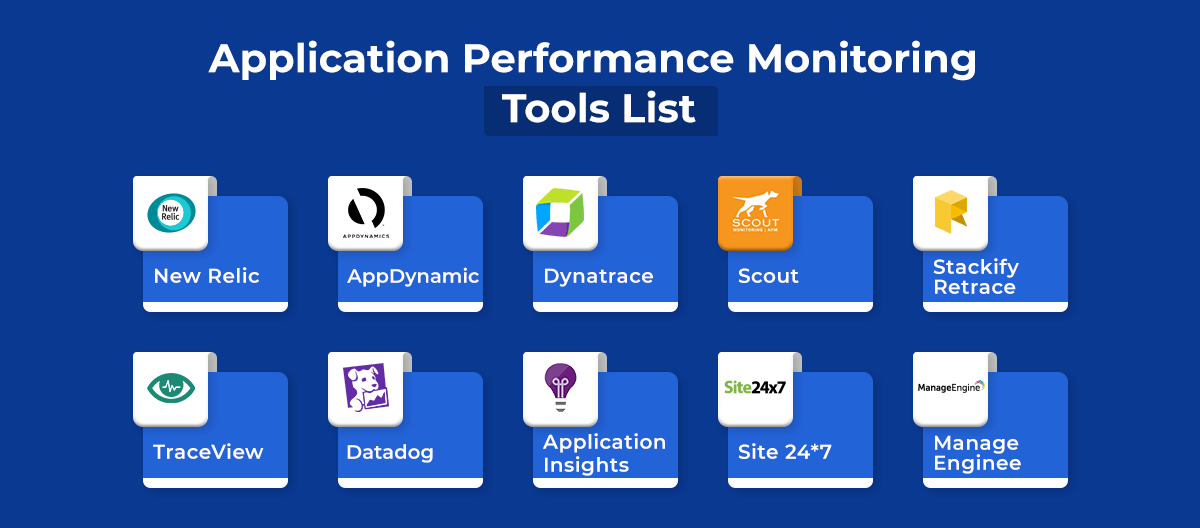
1. New Relic Application Performance Monitoring (Freemium)
Cost: $75-600 per month, per server, cheaper Annually
Lew Crine founded the New Relic in 2008. Since then, it has swiftly expanded and evolved into an essential tool for developers, IT support teams, and business executives. It now serves thousands of happy customers, assisting them in improving the performance of their applications. It also offers APM for mobile apps, advanced browser performance monitoring, and infrastructure monitoring, which was just added.
Features of New Relic
- Languages: .NET, Java, Ruby, Python, Node.js, Go, PHP
- It’s SaaS Only
- Application Monitoring performance trends at a glance
- User perspective insights on Browser Monitoring
- Track Performance of individual SQL Statements
- Low-impact production thread profilers.
- Code-level daignostics
- Cross-Application Tracing
- Monitor critical business
2. AppDynamic Application Performance Monitoring (Freemium)
Cost: $230 per month, per server
AppDynamics is a San Francisco-based company that provides automated cross-stack intelligence for BI and application performance monitoring. AppDynamics was started in 2008 and has raised $206,500,000 in five rounds of investment. Cisco purchased the company in 2017 for $3,700,000,000, and it is now part of Cisco’s IoT and Applications division.
In the Gartner Magic Quadrant study report, AppDynamics was rated APM leader for the 9th time. Application Performance, End User Monitoring, Infrastructure Visibility, and Business Performance are the four product suites that make up the AppDynamic Platform.
Features of AppDynamic
- Languages: .Net, Java, PHP, C++, Python, Node.js
- End-to-End transaction tracing
- Code Level Visibility
- Dynamic baseline & alerting
3. Dynatrace Application Performance Monitoring (Freemium)
Cost: $216 per month per server for the SaaS version
DynaTrace is a self-learning application performance monitoring tool that was originally known as Compuware APM. It delivers auto-discovered topological visualizations of programs and their components using its agent. This distinguishes DynaTrace as an application performance monitoring tool. One thing to bear in mind, though, is that learning takes time. Therefore, you may have to wait until enough data points have been collected before you stop getting false positives.
Features of DynaTrace
- Languages: .NET, Java
- SaaS or On-premise
- Visualizes application topology, deployments, and environment changes in real-time.
- Performance issues in web-scale applications discovered with artificial intelligence.
- Auto-discovers all application components and dependencies end-to-end.
- The entire application topology is visualized in an interactive infographic.
- Dynatrace automatic baselining learns how your application works.
4. Scout (SolarWinds) (Freemium)
Cost: $59 per month per server
Scout delivers auto-discovered topological visualizations of programs and their components using its agent. This distinguishes DynaTrace as an application performance monitoring tool. One thing to bear in mind, though, is that learning takes time. Therefore, you may have to wait until enough data points have been collected before you stop getting false positives.
Features of Scout
- Languages: Ruby on Rails
- Memory Leak Detection
- Slow Database Query Analysis
- Github Integration
- Automatic Dependencies Population
5. Stackify Retrace (Freemium)
Cost: $25-50 per month per server, $10 for non-production
Retrace is a developer-friendly SaaS APM tool. Its purpose is to assist developers in optimizing the performance of their applications in QA and “retracing” application faults in production using extremely comprehensive code-level transaction traces. Prefix, a free APM tool for workstations, assists developers in writing and testing code. Retrace is designed to be easy to use and economical for all sizes of developer teams.Languages: .NET, .NET Core, Java
Features of Retrace
- SaaS-based
- Integrated errors & log management
- Detailed code level transaction traces
- Optimized for developers
- Includes application metrics & server monitoring
- Very low overhead
- Easy to use and install
6. TraceView (Freemium)
Cost: $79 per month + Storage $19 per GB per month
Tracelystics was the original name for this product, which was later bought by AppNeta and is now part of SolarWinds. SolarWinds includes all of the basic dashboard and drill-down capabilities that you’d expect.
Features of TraceView
- Language: .NET, Java, PHP, Python, Ruby on Rails, Node.js, GO
- Advanced visualization with filtering & drill-down
- Cross-host, distributed transaction tracing
- Latency, host, and error-based alerting
- Distributed Transaction Tracing
- Error reporting at every layer
- Machine-level metric collection & charting
- Real User Monitoring (RUM)
- Java Management Extension (JMX) monitoring support
7. Datadog Application Performance Monitoring (Freemium)
Cost: $31 per host, per month
Datadog Application Performance Monitoring allows you to examine and identify dependencies, remove bottlenecks, reduce latency, track mistakes, and increase code efficiency to optimize your application.
Distributed traces integrate with browser sessions, logs, profiles, synthetic tests, process-level data, and infrastructure metrics to provide complete insight into the health of your application across all hosts, containers, proxies, and serverless operations.
Features of Application Performance Monitoring Datadog
- Seamless Correlation
- Tracing Without Limits
- Continuous Profiling
- Real User Monitoring & Synthetics
- Auto-Detect Anomalies
- Seamless Application Navigation
- 450+ Key Integrations
8. Application Insights (Freemium)
Cost: Pay-as-you-go: $2.76, starts with $219.52 per day – $9016 per day, with regards of GB used starting with 100GB to 5000 GB.
Application Insights is an extendable Azure Application Performance Monitoring (APM) service for developers and DevOps professionals that is part of Azure Monitor. It can be used to keep track of your live applications. It offers strong analytics capabilities to help you troubleshoot issues and learn what users do with your app. In addition, it will automatically discover performance irregularities. It’s made to help you enhance your performance and usability over time. It supports apps written in.NET, Node.js, Java, and Python hosted on-premises, in a hybrid cloud, or any public cloud. In addition, it connects to several development tools and integrates with your DevOps process.
Features of Application Insights
- Platform: Windows, Android, iOS
- Monitors response time for various request
- Rapidly identify & fix the issue
- Powerful Alerting system
- Various Metrics & Dashboard for seamless interaction
9. Site 24*7 (Freemium)
Cost: Starts $7.49 – $183.08
Zoho Corporation’s Site24x7 is a cloud monitoring solution. Site24x7 was created by combining the skills of Zoho, a leading SaaS provider of business and productivity apps, with Manage Engine, a leading IT management software package.
With over 10,000 clients globally, Site24x7 makes it simple for IT teams and DevOps of all sizes to diagnose issues in their apps and infrastructure. In addition, site24x7 APM Insight is a real-time application performance monitoring solution that helps you improve the performance of your applications.
You can analyze your application behaviour and bridge the gap between end-user experience and application performance with Site24x7 APM Insight.
Features of Site 24*7
- Website Monitoring
- Server Monitoring
- Application Monitoring
- Cloud Monitoring
- Log Management
- Network Monitoring
- Real User Monitoring
10. Manage Enginee Application Manager (Freemium)
Cost: Free, Professional: starts at $395 for ten monitors, Enterprise: starts at $9,595 for 250 monitors.
ManageEngine Applications Manager is an all-in-one application performance monitoring solution designed for today’s complex and dynamic environments. It provides detailed insight into the performance of business-critical applications, both in the data center and in the cloud. In addition, it’s simple to use and set up in a matter of minutes.
Key Features of Manage Engine Application Manager
- Languages: Java, .NET, PHP, Node.js & Ruby
- Agent-based Monitoring
- Byte-code instrumentation
- Code-level daignostics
- Synthetic transaction Monitoring
- Extensive Monitoring for a variety of options
- Rapidly identify & fix the issue
- Machine Learning enabled analytics
- Used by varied roles in 5000+ businesses worldwide.
Open Source Application Performance Monitoring Tools List
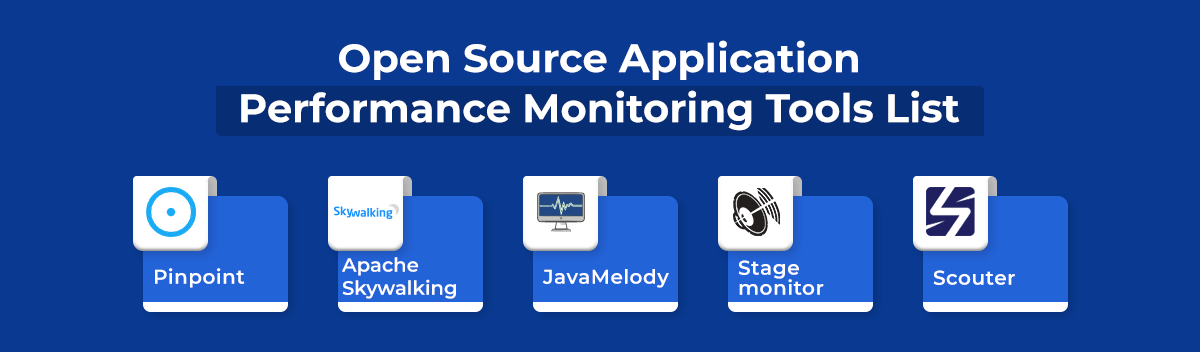
Pinpoint
GitStars: 11.7K
Pinpoint is the most popular APM tool on Github right now. Pinpoint is a fantastic alternative for enterprise enterprises because it is designed for large-scale distributed systems written in Java and PHP. In addition, pinpoint tracking technology allows you to evaluate the structure of your system and how your components are interconnected.
Features of Pinpoint
- The ability to quickly understand your application topology
- Monitor your application in real-time
- Get code-level visibility into all your transactions
- APM agent installs without changing any code
Apache Skywalking
GitHub stars: 17.7K
SkyWalking is an Application Performance Monitoring solution for teams working with Microservices, cloud-native, and container-based architectures (Docker, Kubernetes, Mesos).
Features of ApacheSkywalking
- Service, service instance, and endpoint metrics analysis
- Root cause analysis
- Service topology map analysis
- Service, service instance, and endpoint dependency analysis
- Slow services and endpoints detected
- Performance optimization
- Distributed tracing and context propagation
- Alarm
JavaMelody
Github Stars: 2.4K
JavaMelody aims to keep track of Java or Java EE applications in both QA and production settings. It is not a tool for simulating user requests; rather, it is a tool for measuring and calculating statistics on the real-time operation of an application based on user usage.JavaMelody is open-source (ASL) and production-ready, having been used in a 25-person-year application. JavaMelody is lightweight and easy to integrate into most applications (no profiling and no database).
JavaMelody is primarily based on request statistics and evolution charts.
Features of JavaMelody
- provide statistics on average response times and the number of executions
- When trends are negative, make judgments before problems get too serious, and optimize based on the more limiting response times
- find out what’s causing your reaction times to be so long
- Verify whether or not the improvements are real after they’ve been made.
Stage monitor
GitHub Stars: 1.7K
Stage monitor may be what you’re seeking if you want to track the performance of Java server applications. It includes several tools to aid in the development, testing, and production of Java-based web applications and performance monitoring. It also includes a monitoring agent with clustered application stack capabilities.
Features of Stage Monitor
- In-browser widget
- Analyze requests using the Kibana dashboard
- Cluster Monitoring Capabilities
- Supports creating new plugins
Scouter
GitHub Stars: 1.8K
Scouter presents itself as an open-source alternative to New Relic APM and AppDynamics for application performance monitoring. Scouter provides the ability to track targets such as:
- Java agent for Web applications
- Redis, Nginx, MongoDB, RabbitMQ, and Elasticsearch
- Zipkin
It also shows you metrics like
- User Activity
- Service Activity
- Resource Metrics
Wrapping Up!
On the market, there are a plethora of application performance monitoring solutions. Almost all of them are aimed at large businesses and IT departments. Application Performance Monitoring (APM), which has evolved beyond website monitoring, now includes visibility into the application’s code-level performance in addition to uptime and performance tests. Application performance monitoring tools can highlight where something went wrong and provide more insight into why it happened by combining internal and external performance monitoring data. This has several advantages in modern DevOps systems, including decreased overhead, inter-departmental synchronization, a shorter Mean Time to Repair (MTTR), and a faster time to market.
Also Check:


 Say
Say