Quick Summary: Any application’s success is largely determined by its performance. In today’s digital age, where apps are a component of business for some, they are the business for others. Because so many users rely on the applications for their day-to-day tasks, the application’s performance has become critical to its success. Therefore, for any firm to offer and maintain a flawless user experience, the best use of Application Performance Management Software is vital.
IT teams can employ automated Application Performance Monitoring (APM) tools to gain insights into the performance of their applications and uncover hidden issues. This data can be utilized to help prevent problems while also increasing availability and performance.
Because the ordinary environment is too complicated for administrators to monitor and discover technical events that can damage the application’s quality, APM is essential.
For example, assume your organization has a large number of end-users. A problem that affects many people could get lost in the background noise on your monitoring screen.
These issues will be brought to your attention by APM tools, which will link them to the underlying infrastructure failure.
Let’s understand this with an example.
Your users are suffering latency, and one of your e-commerce plugins is seeing lower throughput. Both concerns will be flagged by an application monitoring tool, putting you in the appropriate route.
APM tools tend to look at the larger picture, focusing on issues that affect your end-users, such as load time, price glitches, abandoned transactions, and so on.
Traditional monitoring technologies have several flaws, one of which is their lack of information. They’ll tell you there’s an issue with the app, but they won’t tell you why.
Monitoring technologies that use AI/ML to expand monitoring and find more specific anomalies can considerably boost application performance management.
Definition: What is Application Performance Monitoring (APM)?
Monitoring metrics on a dashboard with a monitoring solution isn’t all that application performance monitoring entails. In layman’s terms, app performance monitoring entails ensuring that your business applications work as expected, with all performance concerns properly tracked and reported.
In every organization, the ultimate purpose of application performance monitoring software is to ensure that services are delivered to end-users without interruption. Application performance monitoring shouldn’t be confused with Application performance management. They are often interchangeable as ‘APM.’
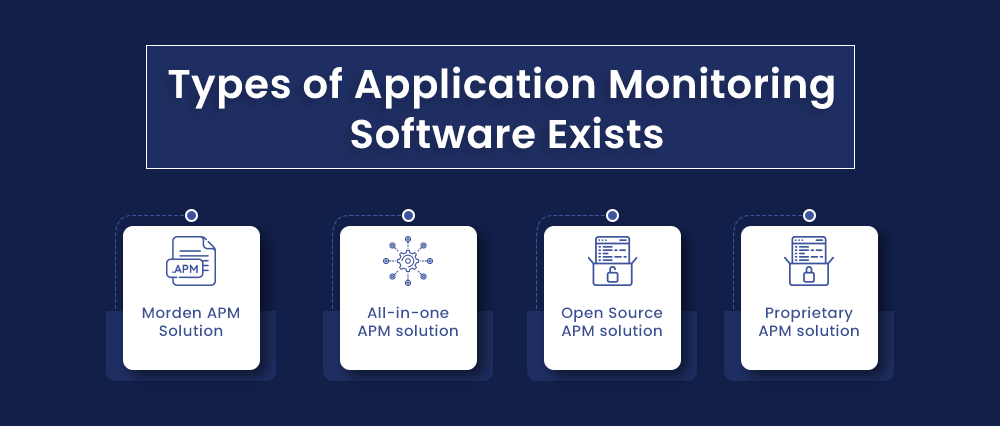
Types of Application Monitoring Software Exists.
- Morden APM Solution
- All-in-one APM solution
- Open Source APM solution
- Proprietary APM solution
Let’s divide IT operations into three broad areas.
- Server & Infrastructure
- DevOps
- End-User Experience
The bounds of application performance monitoring tools will become increasingly evident as we explore these three components in greater depth. While operations across the stated teams frequently overlap, it is critical to understand the extent of these operations and their significance in ensuring a seamless application lifecycle process with minimal performance problems.
Application Monitoring tool for Server monitoring & Infrastructure
IT Ops teams are responsible for ensuring that the infrastructure and operational environment enabling application deployments are in good working order for internal and external clients. As a result, Application Performance Management services are critical for ensuring a continuous and smooth flow of operations.
In addition, application Performance Monitoring solutions can provide vital benefits for monitoring important business applications, depending on the size, scale, and effectiveness of corporate processes.
An infrastructure layer is the foundation of every software stack. Infrastructure monitoring includes steps such as monitoring CPU use, load, memory consumption, server & application monitoring, etc. It’s also an element of monitoring application performance. Consider the scenarios below.
- Information about CPUs that are running at full capacity
- Information about system processes that are consuming a lot of resources
- The server’s network load
- Analyzes of the CPU, memory, and disc I/O.
With the help of network performance monitoring, IT administrators may monitor crucial indicators for server and infrastructure performance. It can plan capacity expansion as well as resource allocation.
Although scripts can retrieve some critical indicators, a comprehensive application performance management software can dive deeper to show more than just a few business application performance counters.
If the root components of your application are appropriately measured, it indicates that the foundation of your application performance monitoring principle is solid.
Application performance monitoring software for DevOps
In production contexts, application performance monitoring tools are used to keep track of application performance. Similarly, systematic application monitoring can greatly reduce development time in the development environment while improving application performance and stability. DevOps (development + operations) has been around for a while. It’s crucial to remember that web application performance monitoring is an integral part of DevOps.
Monitor Application performance to measure end-user experience
The purpose of the IT Ops and DevOps teams across the enterprise is to meet customer requests, which is one of the shared goals. Meeting and exceeding client expectations, as well as retaining them over time. A positive user experience encourages customers to utilize the service again, resulting in increased income.
End-user experience monitoring, also known as digital experience monitoring, is enabled by an application monitor, which provides the following benefits to a business. Test & Monitor application performance before launching it
- Awareness of performance issues
- Measuring the impact of third party components
- Performance stats for application across geographies
Core Features of Application Performance Monitoring (APM)
With the help of network performance monitoring, IT administrators may monitor crucial indicators for server and infrastructure performance. It can plan capacity expansion as well as resource allocation.
Although scripts can retrieve some critical indicators, a comprehensive application performance management software can dive deeper to show more than just a few business application performance counters.
If the root components of your application are appropriately measured, it indicates that the foundation of your application performance monitoring principle is solid.
According to Gartner, ” Application performance monitoring (APM) is a suite of monitoring software comprising digital experience monitoring (DEM), application discovery, tracing and diagnostics, and purpose-built artificial intelligence for IT operations.”
The Gartner Magic Quadrant for ApplicationPerformance Monitoring, a leading report on APM, provides a clear definition of APM’s core features. Let’s take a look at the core functionalities of APM.
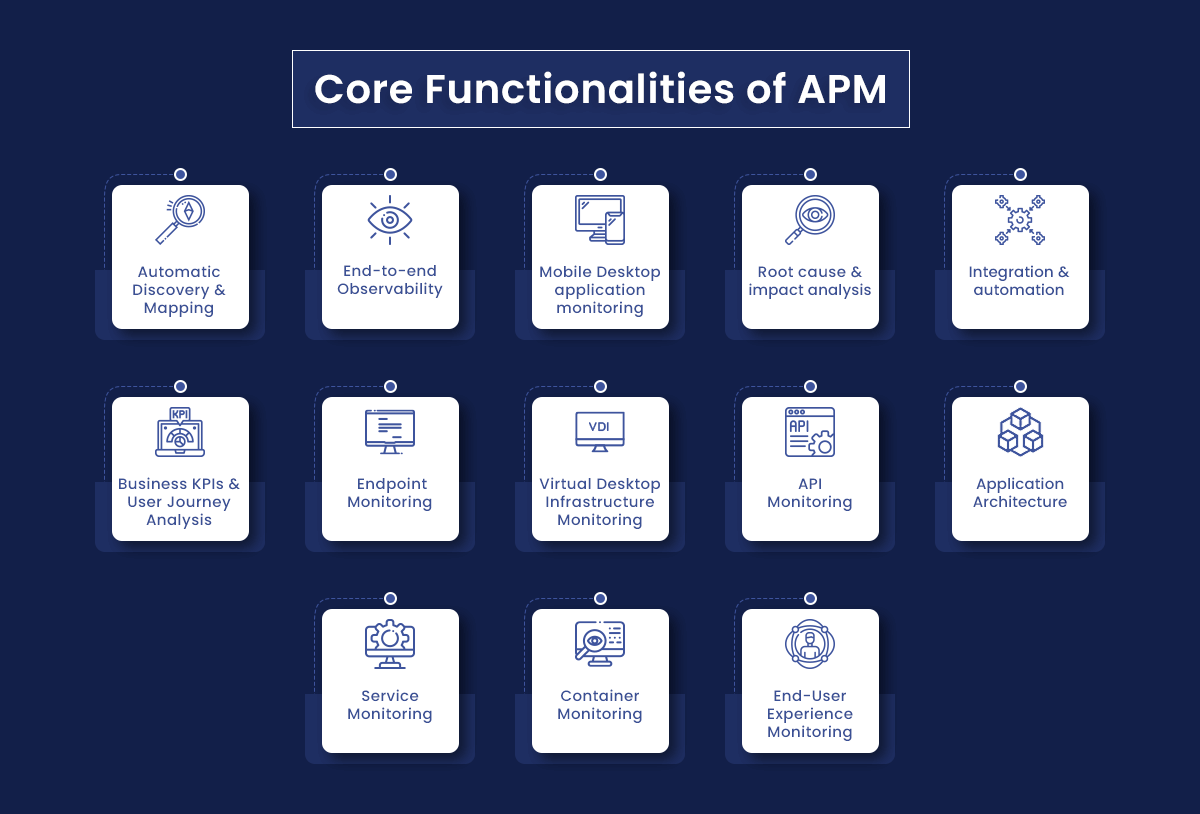
- Automatic Discovery & Mapping
- End-to-end observability
- Mobile Desktop application monitoring
- Root cause and impact analysis
- Integration & automation
- Business KPIs & user Journey analysis
- Endpoint Monitoring
- Virtual Desktop Infrastructure Monitoring
- API monitoring
- Applicaiton Architecture
- Service Monitoring
- Container Monitoring
- End-User Experience Monitoring
Why Application Performance Monitoring?
Let’s take a look at the various advantages offered by Application Performance monitoring.
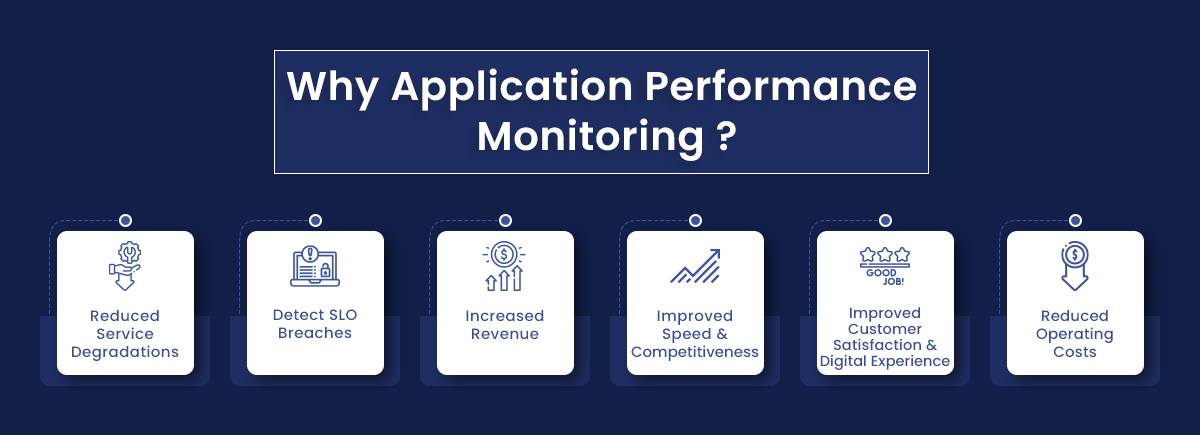
Reduced Service Degradations & SLO Breaches
One of the most compelling reasons to use Application Performance Monitoring is to swiftly fix problems and restore full functionality to satisfy SLOs in the event of an outage while also preventing future outages. APM is an important tool for minimizing mean time to resolution (MTTR) from application-related faults and performance concerns.
Increased Revenue
Customers become frustrated if applications or services are unavailable, and they will seek an alternative, resulting in revenue loss. Therefore, APM does more than just ensure that the program is up and running. However, it also aids in the faster loading of applications. As a result, performance and income improve.
Improved Speed And Competitiveness
Application performance monitoring ensures application optimization, which increases speed and agility, allowing businesses to keep up with industry-driven needs. Latency is synonymous with downtime in most businesses. Therefore enhanced speed and agility translate into a competitive advantage.
Improved Customer Satisfaction And Digital Experience
Your customers will be delighted if your application responds quickly. Latency, which is employed as a ranking factor in both desktop and mobile searches, impacts customers’ decisions. If you don’t evaluate the performance of your mobile and online applications regularly, you’re undoubtedly losing customers.
Reduced Operating Costs
When an application that isn’t being actively monitored fails, it suddenly becomes claustrophobic. As a result, the DevOps teams are put under a lot of pressure. Application Performance monitoring benefits the organization by allowing it to understand any issues better before they become significant. The firm can also save money on IT staffing by employing automated APM Tools.
How Does Application Performance Monitoring Works?
Understanding each real-time transaction is critical to ensuring that the user’s experience is flawless. In a nutshell, end-to-end application performance monitoring is concerned with monitoring the performance of an application from beginning to end.
- Observe applications are behaving normally
- If not, alerting to and collects the data on the source of the problem.
- Analyzing the data in the context of the impact on the business.
- Adapting application environment to fix similar problems before they impact the business.
What Are the Key Application Performance Metrics?
APM tools usually measure three types of metrics known as RED metrics:
Rate: Transaction Executed Rate
Error: If produces any error
Duration: The time it takes to execute the transaction
What Do Application Performance Monitoring Measure: Metrics You Should Track?
Application performance monitoring keeps track of and aggregates data on practically everything that affects app availability. But first, let’s go through some of the most important application performance monitoring KPIs.
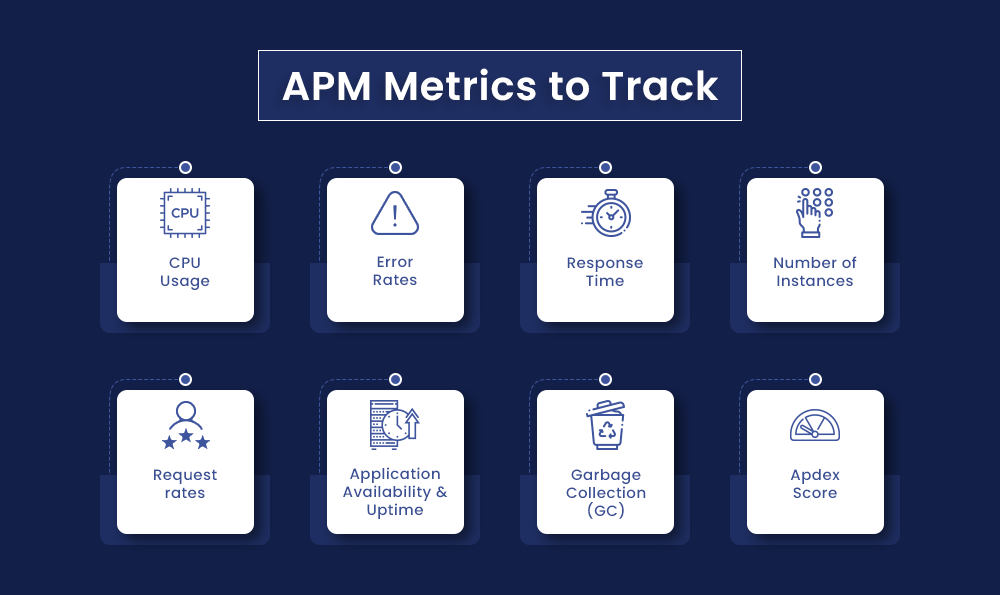
- CPU Usage: At the server level, APM looks at CPU usage, memory demands, & disk read/write speeds to ensure usage doesn’t affect app performance.
- Error Rates: At the software level, APM tracks how often app performance fails.
- Response Time: Average response time is the metric that shows whether the speed is affecting app performance.
- Number of Instances: You need to know how many server or app instances are currently running for elastic and cloud applications. APM solution that supports auto-scaling can then cost-effectively scale applications to meet user’s demands.
- Request rates: These metric monitors the amount of traffic your app receives, including surges, inactivity, or concurrent users.
- Application Availability & Uptime: This metric monitor whether your app is online and available, is one of the most used features to check compliance with SLAs.
- Garbage Collection (GC): If your app is written in JAVA or any other language which uses GC, you’ll be familiar with the problems that arise with the heavy use of memory.
- Customer Satisfaction (Apdex Score): One of the most important measures is how users feel about their experiences. The more the user is satisfied, the more revenue you’ll get.
Application Performance Monitoring strategy requirement
Following are the things that you should include in the APM strategy requirement:
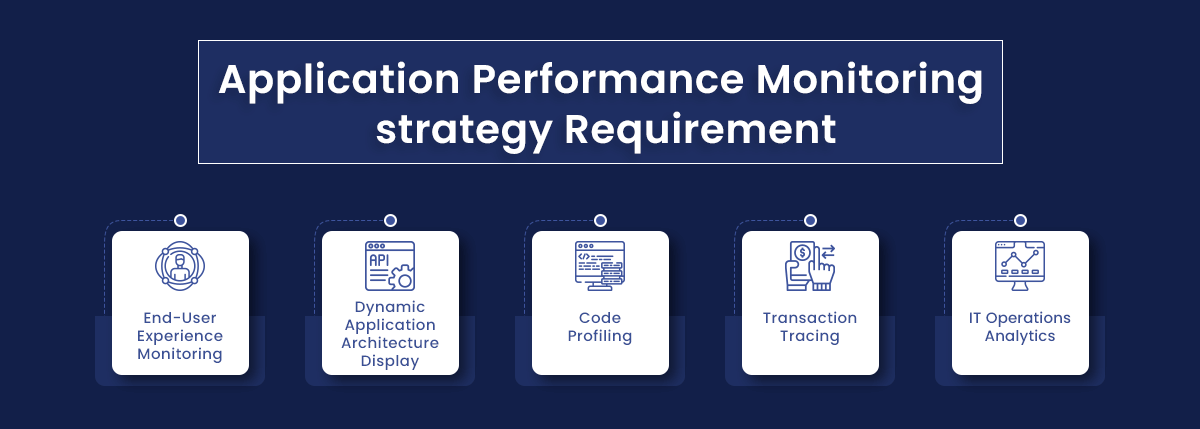
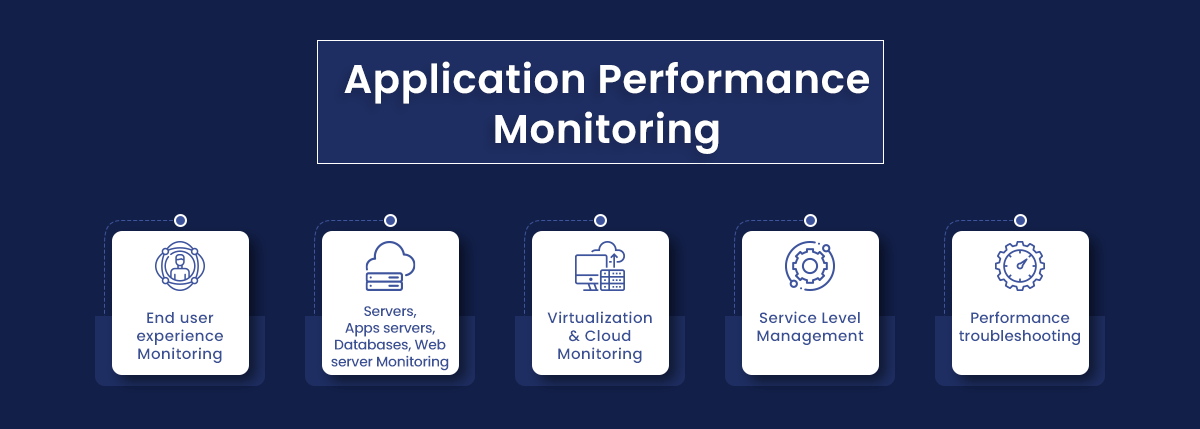
End-User Experience Monitoring
Monitoring how an application behaves from the user’s perspective is also known as digital experience monitoring. It searches for instances of sluggishness, downtime, problems, or bugs. End-user experience can be actively monitored with synthetic monitoring solutions or passively monitored with real-user monitoring.
Dynamic Application Architecture Display
This map, often known as the Service Map, depicts how all application components connect. In real-time scenarios, APM tools automatically find these dependencies, interact with them, and update them. Problem detection is simplified when data is given in a visual format.
Code Profiling
Transaction profiling, also known as code-level performance profiling, examines the flow of each user transaction and isolates specific interactions where performance concerns exist. Tracing allows you to track a user’s movements from the front end to the back end. This way, you’ll be able to pinpoint the particular line of code, database query, or third-party function that’s slowing down the program.
Transaction Tracing
Memory leaks, delayed network connectivity, virtualization bottlenecks, and other performance concerns are common. As a result, infrastructure monitoring is now required to ensure smooth application performance.
IT Operations Analytics
IT Operations Analytics is the process of evaluating data to discover usage patterns, trends, and performance issues so that you may better prepare for similar situations before they become claustrophobic.
Application Performance Monitoring Benefits
As it gives enhanced visibility and insight into application performance and dependencies, application performance monitoring provides a remarkable and growing list of technical and business benefits.
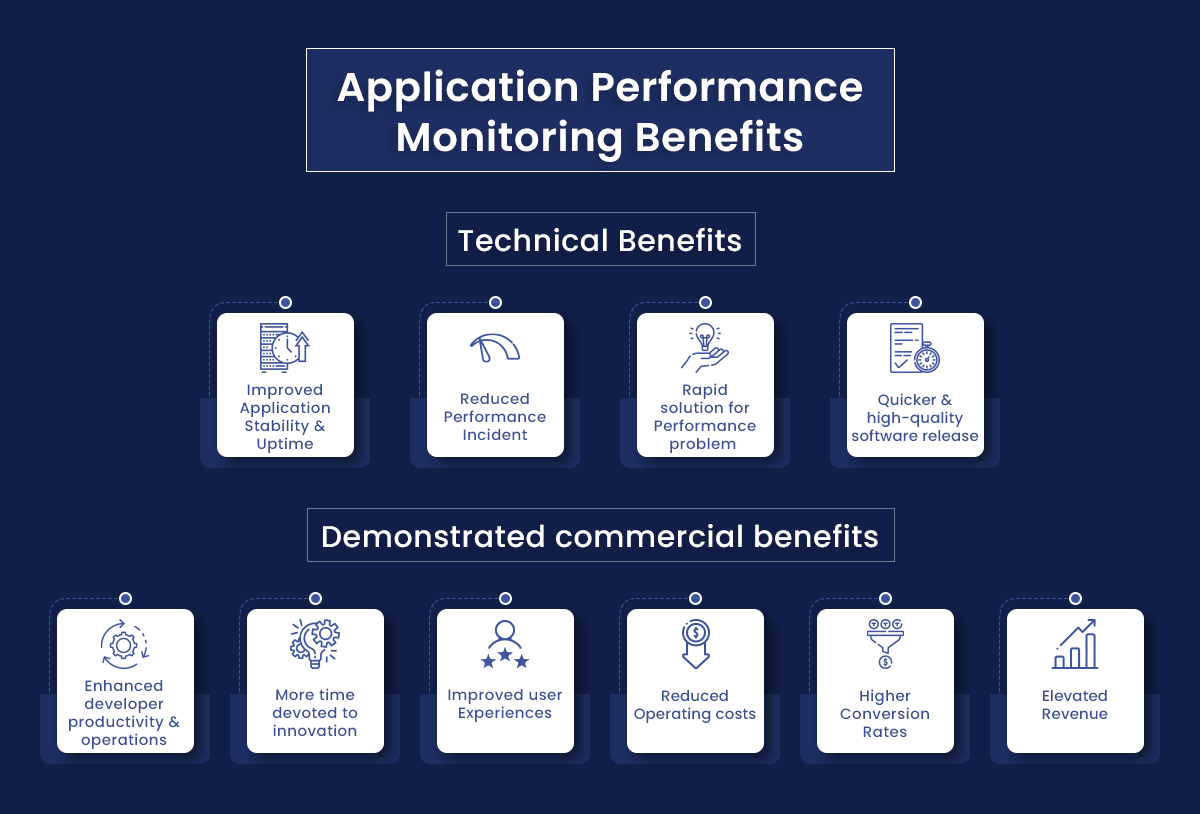
Technical Benefits
Operations, organization, application, and development are all aspects of the business. Adopting application performance monitoring tools and solutions can provide several practical benefits, including:
- Improved Application Stability & Uptime
- Reduced Performance Incident
- Rapid solution for Performance problem
- Quicker and high-quality software release
- Enhanced infrastructure utilization
Demonstrated commercial benefits.
Adopting APM solutions benefits people in the boardroom just as much as those on the front lines of DevOps operations. The following are some of the business advantages:
- Enhanced developer productivity and operations.
- More time devoted to innovation.
- Improved user experiences.
- Reduced operating costs.
- Higher conversion rates.
- Elevated Revenue
How to Measure Application Performance Monitoring Effectively? : Best Practices
Knowing how to use application performance monitoring is one thing; mastering it is another. Here are a few best practices to help you become a valuable member of your team.
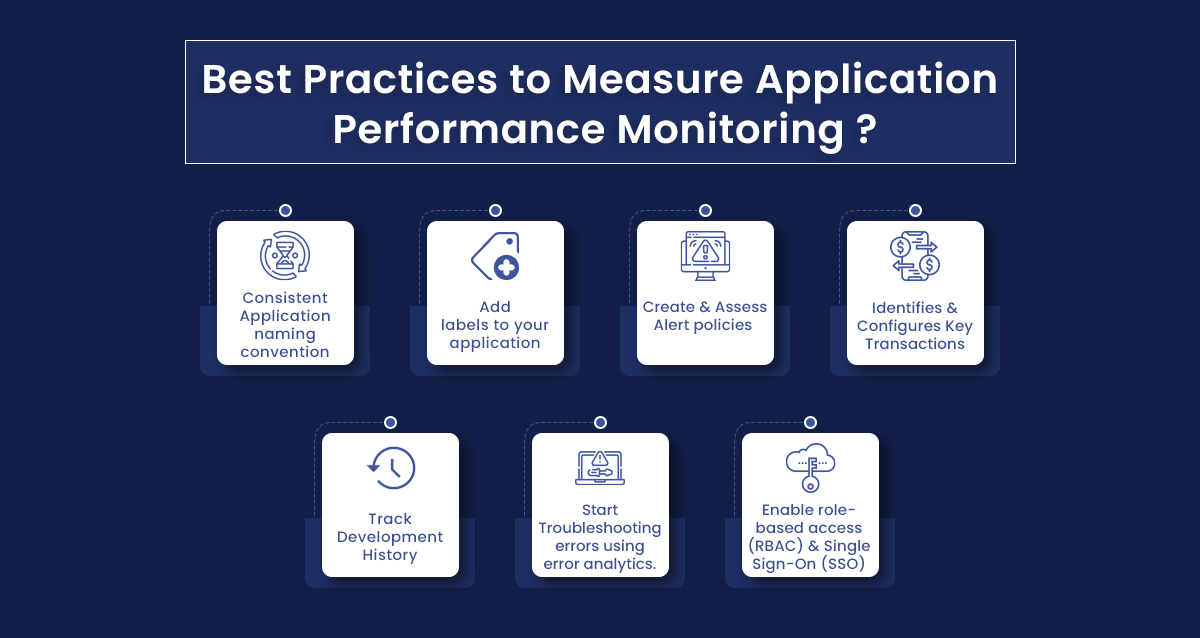
Consistent application-naming convention
The default application name in most APM solutions is “My Application” or “Angular Application.” If you don’t provide one in your configuration file, you’ll wind up with 20 applications with the same name.
When deploying the application, make sure to use a meaningful identification. It is suggested that you use a standardized naming application. For instance, all apps in testing have testing appended to their names.
Add labels to your application
When several different apps use a single account, each application spans several environments, such as development, testing, and production. As a result, finding a certain program in your dashboard can be difficult.
As a result, it is recommended that you utilize labels in your application to organize them into logical groupings. Application name and environment are the most popular labels used by APM users.
Create and assess alert policies
Consulting personnel and the team should be notified when primary performance indicators increase or drop. APM Tools include several tools, such as dynamic baselines, that allow you to discover issues before reaching end-users.
Alert Policies are divided into two key ways:
Static Threshold Alerts
These policies are useful if you already know the application’s nature and expect it to behave in the same way in the future. To build alert policies, Static thresholds such as Apdex score, reaction time, error rates, and throughput came in use.
Dynamic baseline alerts
These alerts make determining and setting dynamic alert thresholds for applications with different seasonal patterns and growth trends a breeze. These notifications are based on past metric data from your application.
You can have as many properties as you like in an alert policy, but each of these alerts should have three elements:
- Type of condition
- Policy Targeted Entities
- Thresholds
Identifies And Configures Key Transactions.
Some transactions may be more significant to you than others, depending on the nature of your application. The key transaction function of APM tools is intended to assist you in closely monitoring what you perceive to be your app’s most critical transactions.
It might be anything, including app response speed, call counts, and mistake rates, among other things. You can also establish alert thresholds to receive notifications when critical transactions are performing poorly.
Track Development History
It’s difficult to determine the impact of each deployment on performance when the development team releases new code often. Deployment reports are the only way to keep track of the effects of these changes.
These reports detail the most recent release and its impact on end-users and app servers. It includes Data on Apdex score, response time, throughput, and faults. It’s also useful for catching mistakes and sharing the details with your team.
Start Troubleshooting errors using error analytics.
The analytic feature of APM tools provides us with various useful tools to analyze & resolve errors. DevOps team can
- Assess the application with fine-grained data on error events.
- Can select any parameter to group or filter errors
- Can assess the stack trace to diagnose for specific errors.
- Identify error trends
Enable role-based access (RBAC) & Single Sign-On (SSO)
In any corporate, security is of paramount importance. You may already be utilizing SSO to ease password management and improve security. You should use APM Tools in the same way. It will be able to enforce strong passwords and prevent unauthorized access.
Popular Application Performance Monitoring Tools
Your microservices, websites, and infrastructure are all monitored 24 hours a day, seven days a week by an APM tool. The system then uses Artificial Intelligence (AI) to analyze the situation and discover problems.
These APM tools assist you in swiftly determining which component of your infrastructure is generating a problem and how it influences other components.
A comprehensive application monitoring solution includes one or more technologies that allow you to track all three basic elements: digital experience monitoring, application discovery, tracing and diagnostics, and artificial intelligence for IT operations.
Unfortunately, no free, open-source applications exist that handle all three features of APM in one place. Typically, they just provide one service, such as infrastructure monitoring, RUM, or tracing, which you can combine if you want to become completely open-source. The popular APM tools in the market are as follows:
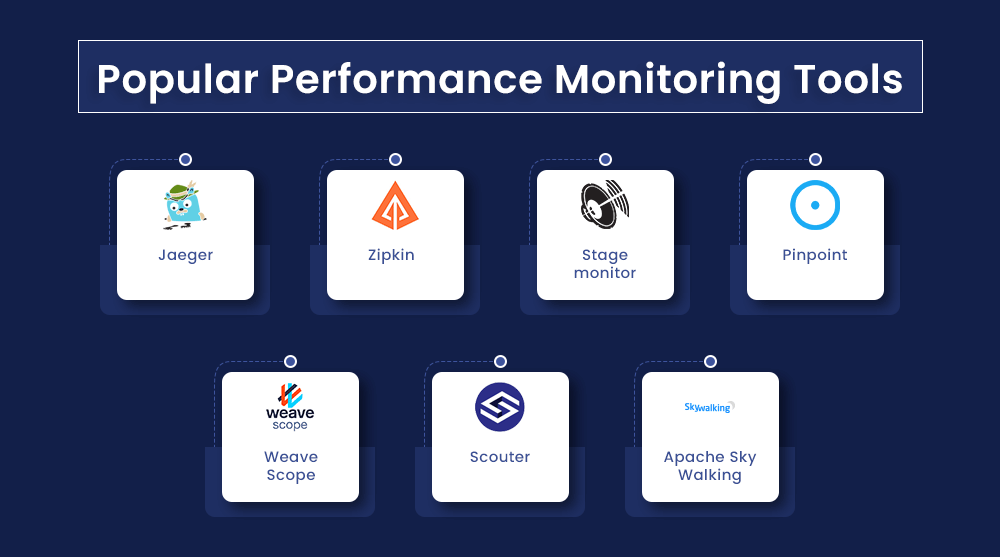
They’ve collected vast communities around them, all of whom are motivated to innovate and assist by developing new features that satisfy users’ needs.
Now that we know which Android performance monitoring tool is the best on the market, we can go on to the next step. But, first, let’s look at some of the characteristics to consider when selecting the right APM Tools.
How to Choose the Right Application Performance Monitoring?
Many Application Performance Monitor solutions exist, each one having its pros and cons. To help you choose the right APM solutions for an organization, below are several key considerations. Along with these things, keep in mind the budget factor also.
Traceability
When a problem arises, the tool should give an alarm and explain why the problem occurred. Some programs even show which section of the code caused problems.
Performance Metrics
Check if the tool can give metrics
- Transaction processing rate
- Response Time
- Page load time
- Load on the host machine
Automated Updates
Is it necessary to restart the machine or any other services running when APM Tools is updated? If this is the case, the end–user will have an unpleasant experience. It can also be a sign that the APM tool is out of date. Morden APM Tools are automatically get updat and do not require a restart.
Data Granularity
It all depends on how quickly can the APM tool collect statistics and logs?
The faster the technology can acquire and analyze more detailed data, the faster it can spot issues.
Application Performance Monitoring Vendors
Application performance monitoring has quickly progressed from a specialized technology to one of the most important. As modern apps become more capable, completing many critical functions on various platforms simultaneously can put a significant burden on organizational resources. That’s why APM suppliers are continually adding new capabilities and increasing their offerings to assist organizations in monitoring vital applications.
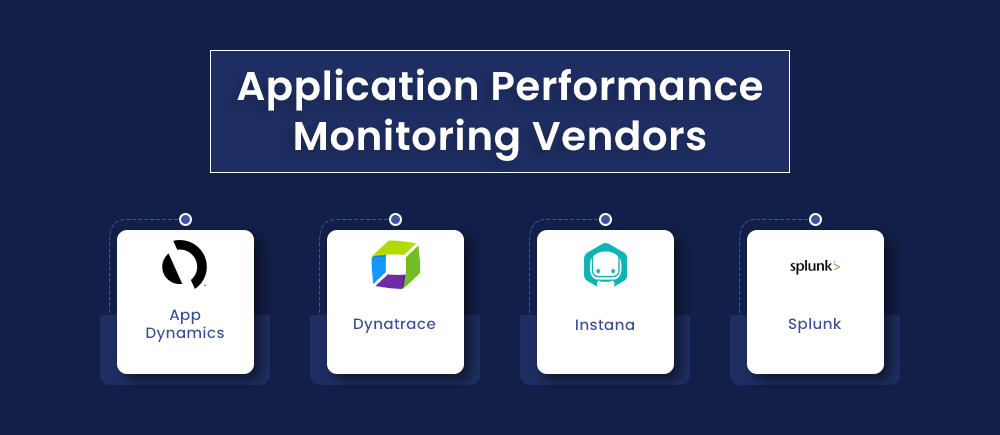
AppDynamics
AppDynamics is a collection of application performance monitoring tools that helps users improve customer and employee digital experiences. Built on an enterprise-grade platform, the suite of applications accelerates digital transformations to improve customer engagement and operational efficiency.
End-user monitoring, infrastructure visibility, and business performance monitoring are among the other capabilities. Gartner’s 2020 Magic Quadrant rate AppDynamics as a Leader for Application Performance Monitoring.
Dynatrace
The Dynatrace Software Intelligence Platform is a comprehensive monitoring platform that integrates network, application, and infrastructure monitoring with AIOps, digital experience management, and digital business analytics.
Users may examine how microservices are doing and rapidly find badly performing because the platform automatically discovers and monitors microservices operating inside containers.
With the release of PurePath 4, Dynatrace has improved its technology to better cover cloud-native applications and environments.
Instana
Instana is a fully automated application performance monitoring system that includes service, infrastructure, container, and website administration. For total visibility, the solution provides continuous full-stack observability of all server and application components and automatic distributed tracking.
IBM has announced its desire to acquire Instana to expand its hybrid cloud and artificial intelligence portfolio by adding application performance monitoring capabilities.
Splunk
Splunk IT Service Intelligence (ITSI) is a monitoring and analytics tool for IT operations and application performance that aims to forecast and avoid application performance issues. The platform provides a high-level view of an application’s or service’s health and performance.
It also allows users to delve deeper into investigations to aid in predicting outages and the speedier identification of the core cause of a problem. In addition, Splunk agreed to buy network monitoring company Flowmill in November, bolstering its network and app monitoring capabilities.
have a unique app Idea?
Hire Certified Developers To Build Robust Feature, Rich App And Websites.
Final Thoughts
The danger of app downtime increases as firms undergo digital transformations such as cloud migration and container orchestration, making application performance management and monitoring more crucial than ever.
Application Performance Monitoring is necessary to ensure software applications’ availability, making its use necessary, especially if you run a SaaS firm. DevOps can use APM tools to determine how application releases affect service performance, security, and reliability.
They allow teams to set up alerts to detect and resolve issues before they hurt the user experience and automate actions based on certain events, patterns, and trends.
Also Check:


 Say
Say