Real-Time Business Insights & Automated Reporting
Transform manual reporting and static spreadsheets into dynamic dashboards and automated reports that deliver real-time visibility into
Sales Performance
Track revenue trends, top-selling products, and customer segments
Financial Health
Monitor cash flow, expenses versus budget, and profit margins
Operational Efficiency
Visualize inventory levels, production throughput, and fulfillment rates
Customer Insights
Analyze acquisition costs, lifetime value, and churn drivers
Empower Every Decision with Data Clarity
Book a free strategy session to explore how data analytics can transform your reporting, visibility, and business outcomes.
Our Data Analytics Services
Transform Data Complexity Into Clarity and Competitive Advantage
Interactive Dashboards
Craft user-friendly dashboards on Power BI and Tableau that let you filter, drill down, and slice data across multiple dimensions.
Self-Service Reporting
Enable your team to generate and customize reports on demand, reducing reliance on IT and accelerating insights.
Predictive Analytics & Alerts
Leverage forecasting models to anticipate demand, optimize pricing, and detect anomalies. Set automated alerts to stay ahead of critical shifts.
KPI Scorecards & Automated Distribution
Design executive scorecards highlighting vital metrics. Schedule regular report delivery via email or collaboration platforms.
Role-Based Access & Security
Ensure each stakeholder sees only the data they need, backed by secure authentication and audit trails.
Unlock Actionable Insights from Your Business Data
Transform your raw data into powerful decisions-connect with our data analytics experts today.
Industry Focused Analytics Solutions
Precision analytics driving growth across every aspect of your business.
Sales & Marketing Analytics
- Real-time pipeline visibility and conversion tracking
- Campaign ROI and customer segmentation insights
- Cross-channel attribution and lead-to-revenue analysis
Financial Performance Management
- Cash flow forecasting and budget variance analysis
- Profitability heatmaps by product, region, and customer
- Rolling forecasts to guide strategic planning
Operations & Supply Chain
- Inventory turnover and lead-time dashboards
- Production efficiency and quality control metrics
- Demand forecasting to minimize stockouts and waste
Customer Success & Retention
- Churn prediction models and satisfaction scorecards
- Customer lifetime value analysis
- Automated alerts for engagement drop-offs
100% Contracts & NDA Protection
Every data analytics project is protected by comprehensive legal agreements including NDAs, IP protection clauses, and GDPR/CCPA compliant data handling procedures. Your intellectual property remains 100% yours.
- USA Legal Standards
- NDA Guaranteed
- GDPR Compliant
100%
IP Protection Guaranteed
Proven Six-Step BI Implementation Process
A stepwise approach ensuring every phase drives better decisions and measurable results.
01
Discover & Define
- Deep-dive into your core metrics, data sources, and business goals
- Map key performance indicators-revenue growth, cash flow, customer acquisition cost
- Align analytics roadmap with market benchmarks and competitive drivers
02
Design & Prototype
- Develop wireframes for interactive dashboards tailored to each team-sales, finance, operations
- Validate prototypes with stakeholders to ensure actionable layouts and insights
- Define drill-down workflows that shorten decision cycles
03
Build & Integrate
- Configure Power BI and Tableau connectors for seamless data access
- Develop robust visualizations-trend analyses, heatmaps, forecasting widgets
- Automate data refresh schedules to deliver fresh insights daily
04
Validate & Optimize
- Conduct user acceptance testing with real-world scenarios
- Refine visualizations based on feedback and performance metrics
- Ensure dashboards load swiftly-even on large datasets
05
Deploy & Train
- Roll out analytics to key stakeholders with tailored training sessions
- Provide step-by-step guides for self-service reporting and dashboard navigation
- Enable mobile-friendly access for executives on the go
06
Support & Evolve
- Proactive monitoring of data pipelines and dashboard performance
- Quarterly reviews to add new visualizations, metrics, and forecasting models
- Strategic roadmapping to scale analytics as your business expands
Why Businesses Choose Us for Analytics & Insights?
Our tailored analytics solutions align with your operational, technical, and compliance requirements, transforming raw data into actionable insights that fuel growth.
AI-Powered Coding
Leverage AI-assisted development with tools like Cursor AI and GitHub Copilot to accelerate delivery, reduce errors, and ensure cleaner, more efficient code for your projects.
Agile & Scrum Expertise
Using Agile, Scrum, and Kanban methods, we ensure timely and iterative delivery of analytics dashboards, reports, and insights with full visibility at every stage.
Fluent English Communication
Fluent English communication and collaborative reporting ensure your team fully understands insights, enabling faster, more confident decision-making.
International Legal Compliance
Our solutions comply with international standards such as GDPR, CCPA, and internal data policies, ensuring your sensitive information remains secure and risk-free.
Industry-Standard Tools
Proficient in Power BI, Tableau, Looker, Excel, SQL, Python, and other leading tools, we integrate seamlessly with your existing data workflows for actionable insights.
Quality Assurance
Rigorous validation, testing, and dashboard quality checks guarantee accurate, reliable, and enterprise-grade insights that you can trust for strategic decision-making.
Our Finest Works
Showcasing the brilliance behind our unique solutions.
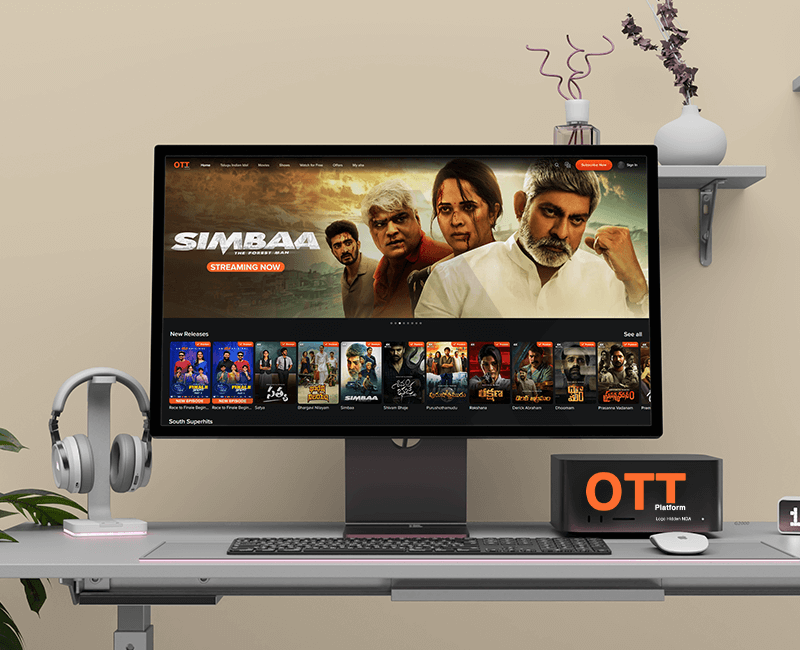


Unlock Insights Across Industries
We help businesses across industries unlock the power of their data, make informed decisions, and drive measurable growth through tailored analytics and reporting solutions.
Retail
Gain deeper insights into customer behavior, sales trends, and inventory performance to make data-driven decisions that enhance profitability and engagement.
Manufacturing
Leverage analytics, production metrics, and quality insights to optimize processes, reduce downtime, and improve operational efficiency.
Construction
Simplify project management, contracts, vendor tracking, and field operations for smoother builds and faster completion.
Blogs & Insights
Stay ahead with proven strategies, industry trends, and practical tips for business innovation and growth.